 |
iRSpot-EL: identify recombination spots with an ensemble learning approach |
Step 1. Open the web server by clicking the link at http://bliulab.net/iRSpot-EL/ and you will see the home page of iRSpot-EL. Click on the ReadMe button to see a brief introduction about the server.
Step 2. Click on the Server button, either type or copy and paste the query DNA sequence into the input box, or you can also upload your input data by the Browse button. The input sequence should be in the FASTA format. A sequence in FASTA format consists of a single initial line beginning with the symbol ">"" in the first column, followed by lines of sequence data in which nucleotides or amino acids are represented using single-letter codes. Except for the mandatory symbol ">", all the other characters in the single initial line are optional and only used for the purpose of identification and description. The sequence ends if another line starting with the symbol ">" appears; this indicates the start of another sequence. Example sequences in FASTA format can be seen by clicking on the Example button right above the input box.
Step 3. Users are able to set two parameters of iRSpot-EL, including size of sliding windows, and step size. For more information of these parameters, please click the "?" symbol near these parameters.
Step 4. Click on the Submit button to see the predicted results. For example, if you use the query DNA sequence in the Example as the input with size of sliding windows = 2 KB, step size = 200, you will see the following on the screen: (1) The query sequence contains one hotspots (sub-sequences: 3601-4200 ), and one coldspot (sub-sequence: 1-2400). (2) By clicking Sequence Information, you will see the sequence information of the corresponding sub-sequence. (3) By clicking Detailed results, you will see the detailed prediction results for each sliding window in the sub-sequence.
Step 5. The distributions of the hotspots and coldspots along the input sequence can be visualized by clicking the Result visualization button near the query sequence name.
Performance of iRSpot-EL
In statistical prediction, the following three cross-validation methods are often used in literature to examine a predictor for its effectiveness in practical application: independent dataset test, subsampling or K-fold cross-validation test, and jackknife test (1). In this study, the five-fold cross-validation was used. The benchmark dataset was randomly divided into five subsets with an approximately equal number of samples. Each predictor runs five times with five different training and test sets. For each run, three sets were used to train the predictor, one set was used as the validation set to optimize the parameters, and the remaining one was used as the test set to give the final results.The 5-fold cross-validation success rates by iRSpot-EL on the widely used yeast benchmark dataset (3) are given in Table 1, where for facilitating compression the corresponding rates by the other methods are also given. As we can see from the table, iRSpot-EL outperformed the other four state-of-the-art predictors in both the accuracy and stability.

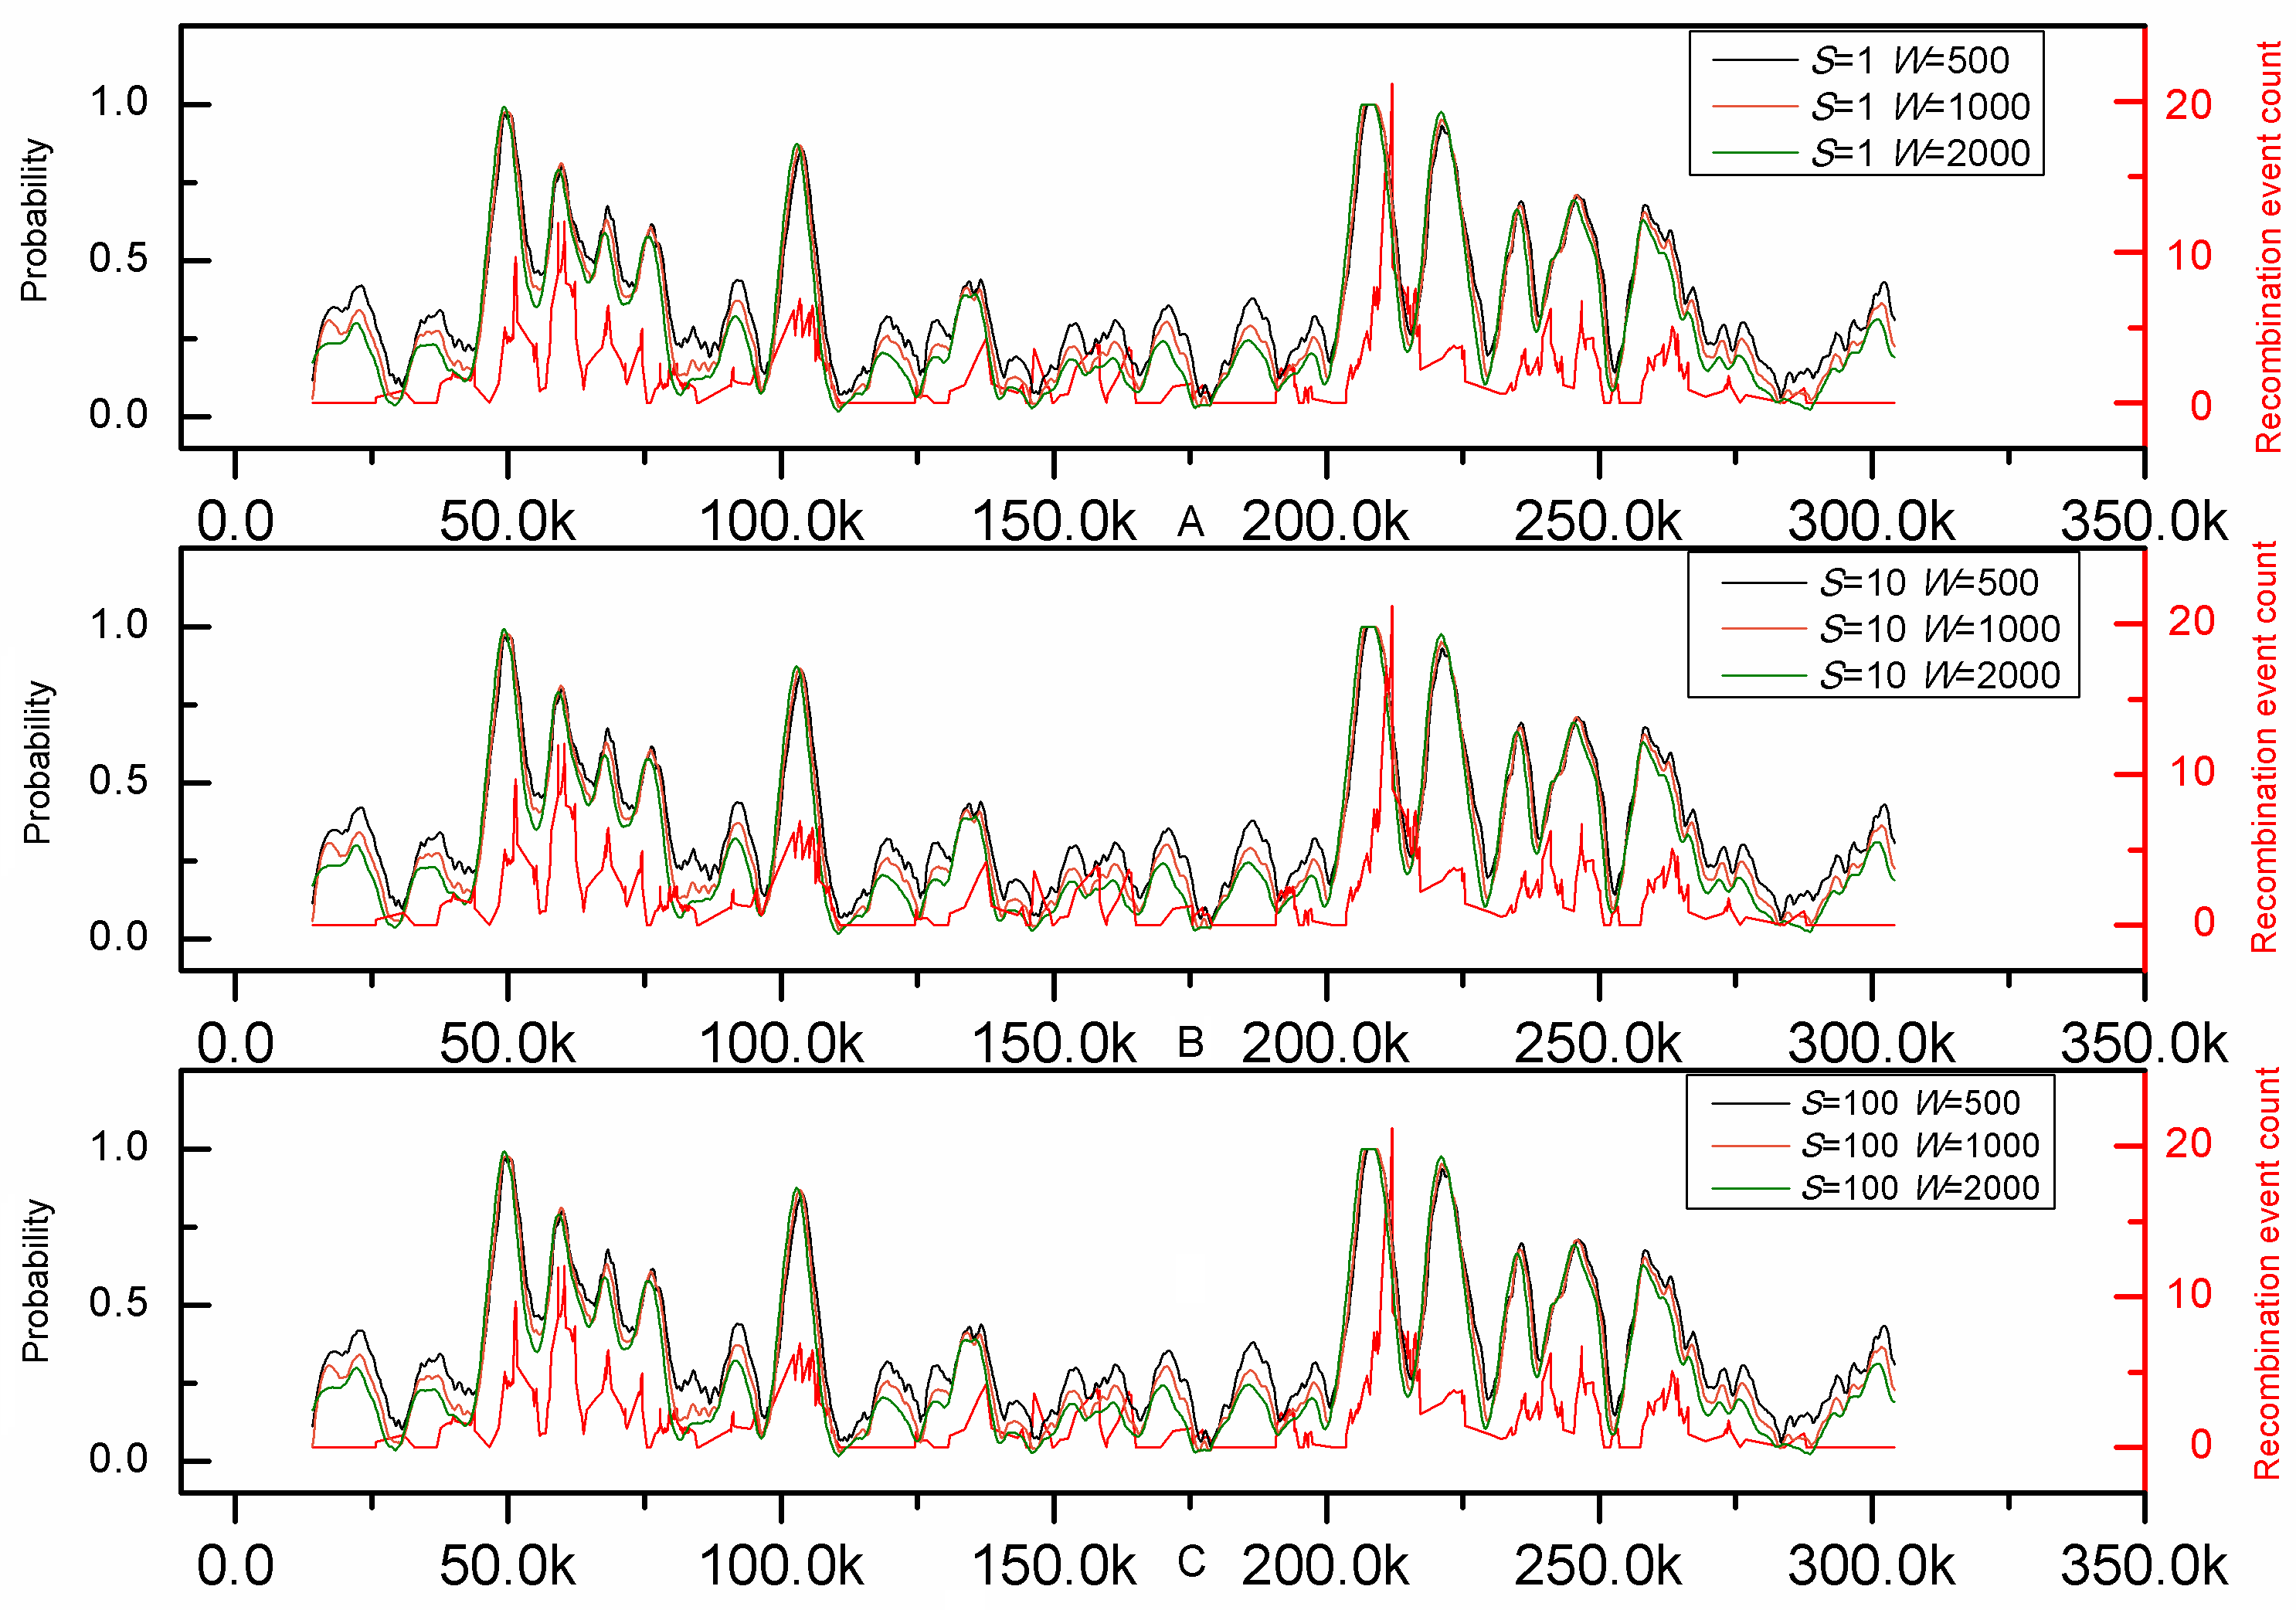
To further demonstrate its practical application, the genome-wide analysis by iRSpot-EL was performed on the yeast chromosome III. The result thus obtained on such an independent DNA sequence is given in Fig.1, where for facilitating comparison the corresponding recombination profile by experiments (8) is also shown. It can be clearly seen from the figure that the recombination profile predicted by iRSpot-EL is highly consistent with that of experimental observations (8), indicating that iRSpot-EL will be a very useful high throughput tool for genome-wide analysis of recombination spots.
Established on 01-November-2015, the iRSpot-EL web-server has been widely and increasingly used by scientists all around the world in dealing with various problems in this area, as reflected by the citation numbers of our some pioneering papers given in the References Section.

Figure 1. Comparison between prediction results of iRSpot-EL and experimental map along chromosome III. The red line represents the recombination event rate determined experimentally by Mancera et al. (8). The others represent probability values calculated by iRSpot-EL with different sliding window sizes and step sizes.
REFERENCES
1.Chou, K.C. and Zhang, C.T. (1995) Review: Prediction of protein structural classes Crit. Rev. Biochem. Mol. Biol, 30, 275-349. (cited by 978 papers)
2.Chou, K.C. (2011) Some remarks on protein attribute prediction and pseudo amino acid composition (50th Anniversary Year Review) J. Theor. Biol, 273, 236-247. (cited by 492 papers)
3.Liu, G., Liu, J., Cui, X. and Cai, L. (2012) Sequence-dependent prediction of recombination hotspots in Saccharomycescerevisiae. Journal of Theoretical Biology, 293, 49-54.
4.Liu, B., Fang, L., Long, R., Lan, X. and Chou, K.C. (2015) iEnhancer-2L: a two-layer predictor for identifying enhancers and their strength by pseudo k-tuple nucleotide composition. Bioinformatics, doi:10.1093/bioinformatics/btv1604.
5.Jiang, P., Wu, H., Wei, J., Sang, F., Sun, X. and Lu, Z. (2007) RF-DYMHC: detecting the yeast meiotic recombination hotspots and coldspots by random forest model using gapped dinucleotide composition features. Nucleic Acids Research, 35, W47-W51.
6.Chen, W., Feng, P.-M., Lin, H. and Chou, K.-C. (2013) iRSpot-PseDNC: identify recombination spots with pseudo dinucleotide composition. Nucleic Acids Research, 41, e68. (cited by 195 papers)
7.Qiu, W.-R., Xiao, X. and Chou, K.-C. (2014) iRSpot-TNCPseAAC: Identify Recombination Spots with Trinucleotide Composition and Pseudo Amino Acid Components. International Journal of Molecular Sciences, 15, 1746-1766. (cited by 90 papers)
8.Mancera, E., Bourgon, R., Brozzi, A., Huber, W. and Steinmetz, L.M. (2008) High-resolution mapping of meiotic crossovers and non-crossovers in yeast Nature, 454, 479-485.