1. The main interface of server :
First, click the "Server" button on the navigation bar, and the main interface of server is shown in Figure 1. Next, enter the protein sequences to start the calculation.
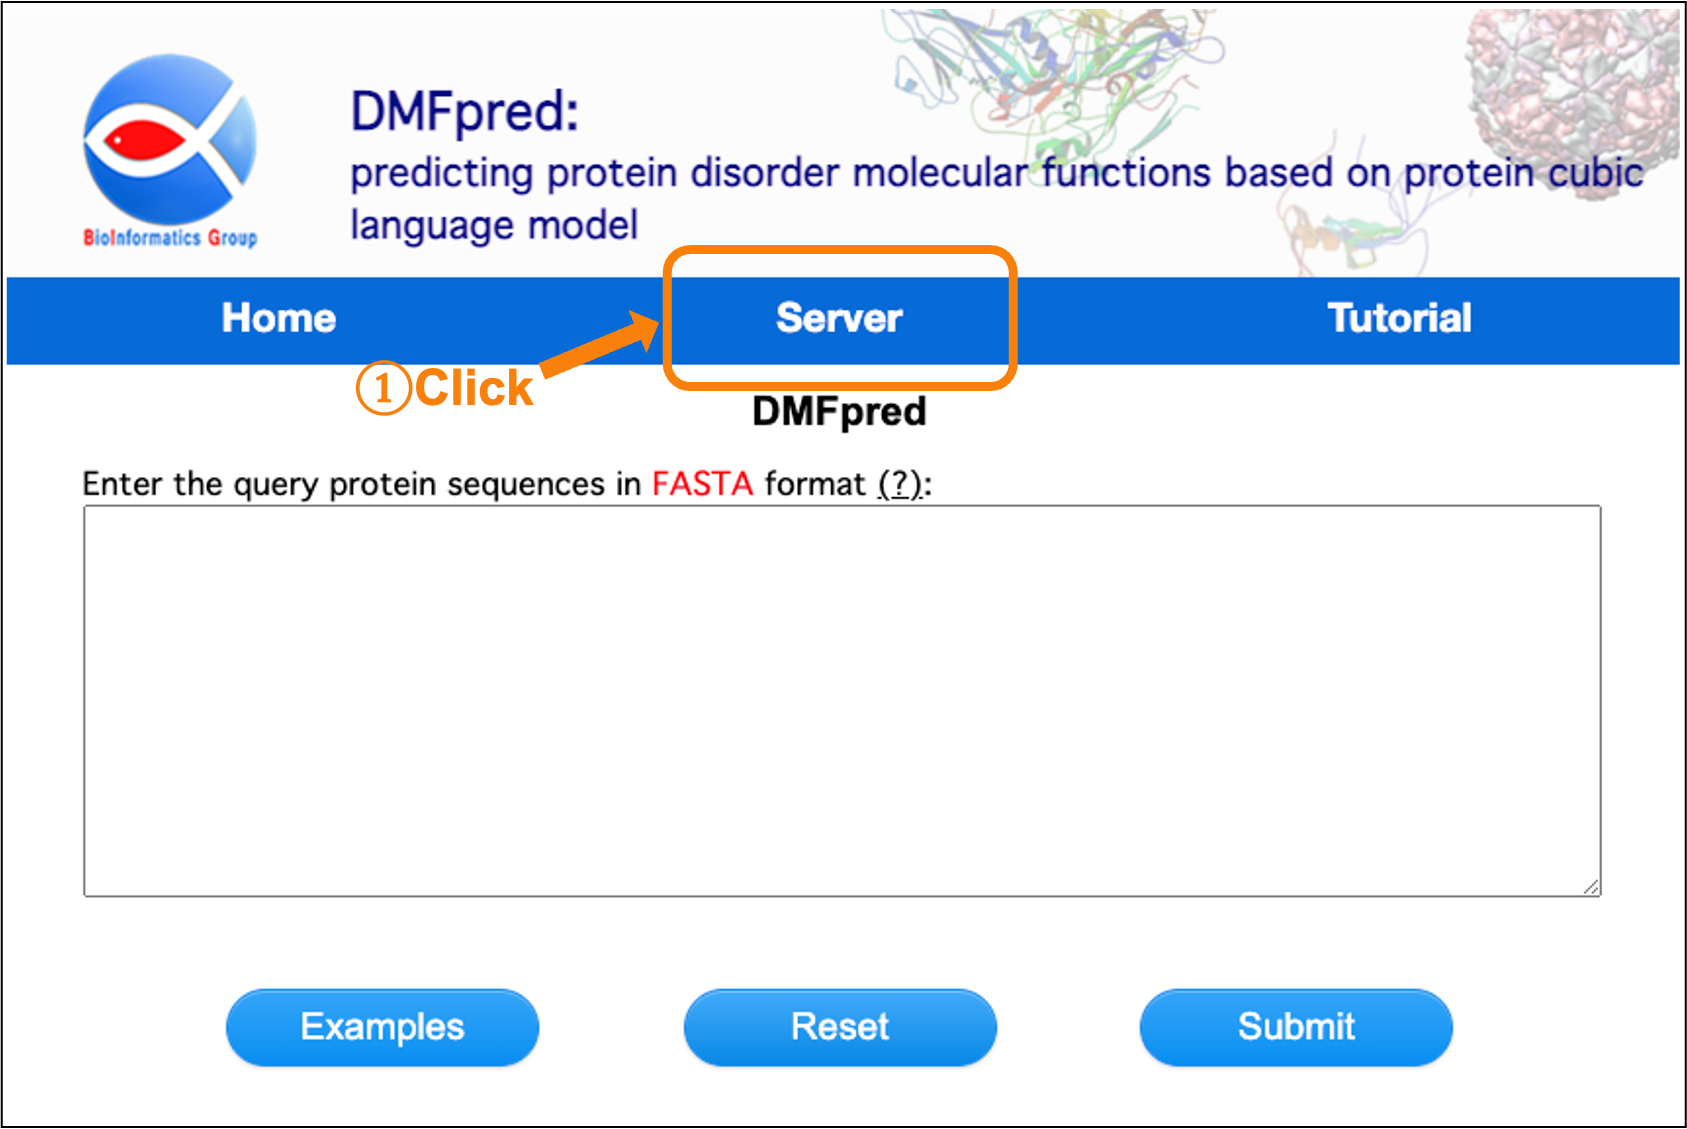
Figure 1. The main interface of server.
2. Enter the protein sequences to be analyzed:
Next, enter the sequences to be analyzed in the text input box. The input sequence data should be in Fasta format, which is a sequence identifier starting with ">" and following with a sequence consisting of 20 standard amino acids in a separate line. Maximum 5 sequences for each submission. Then, click the "Submit" button for processing the analysis (see Figure 2).
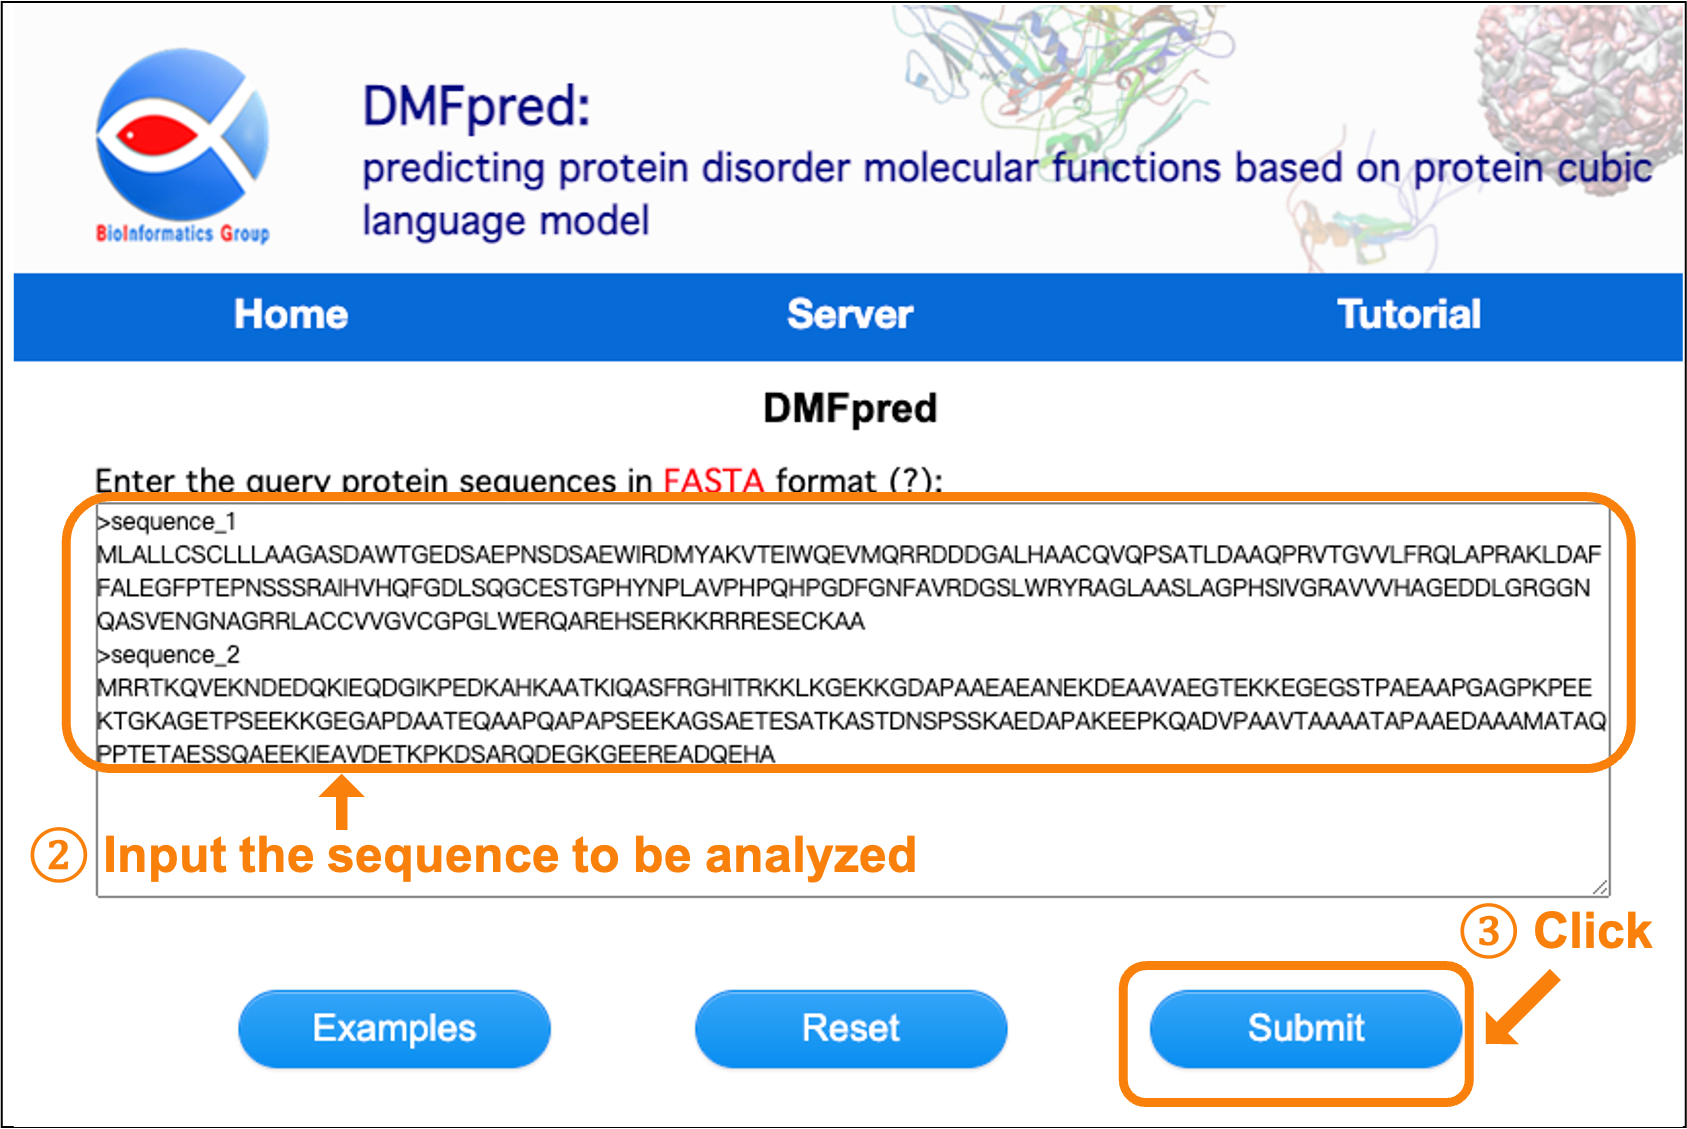
Figure 2. Screenshot of entering protein sequences.
You can also click the "Example" button to load an example sequence (see Figure 3).
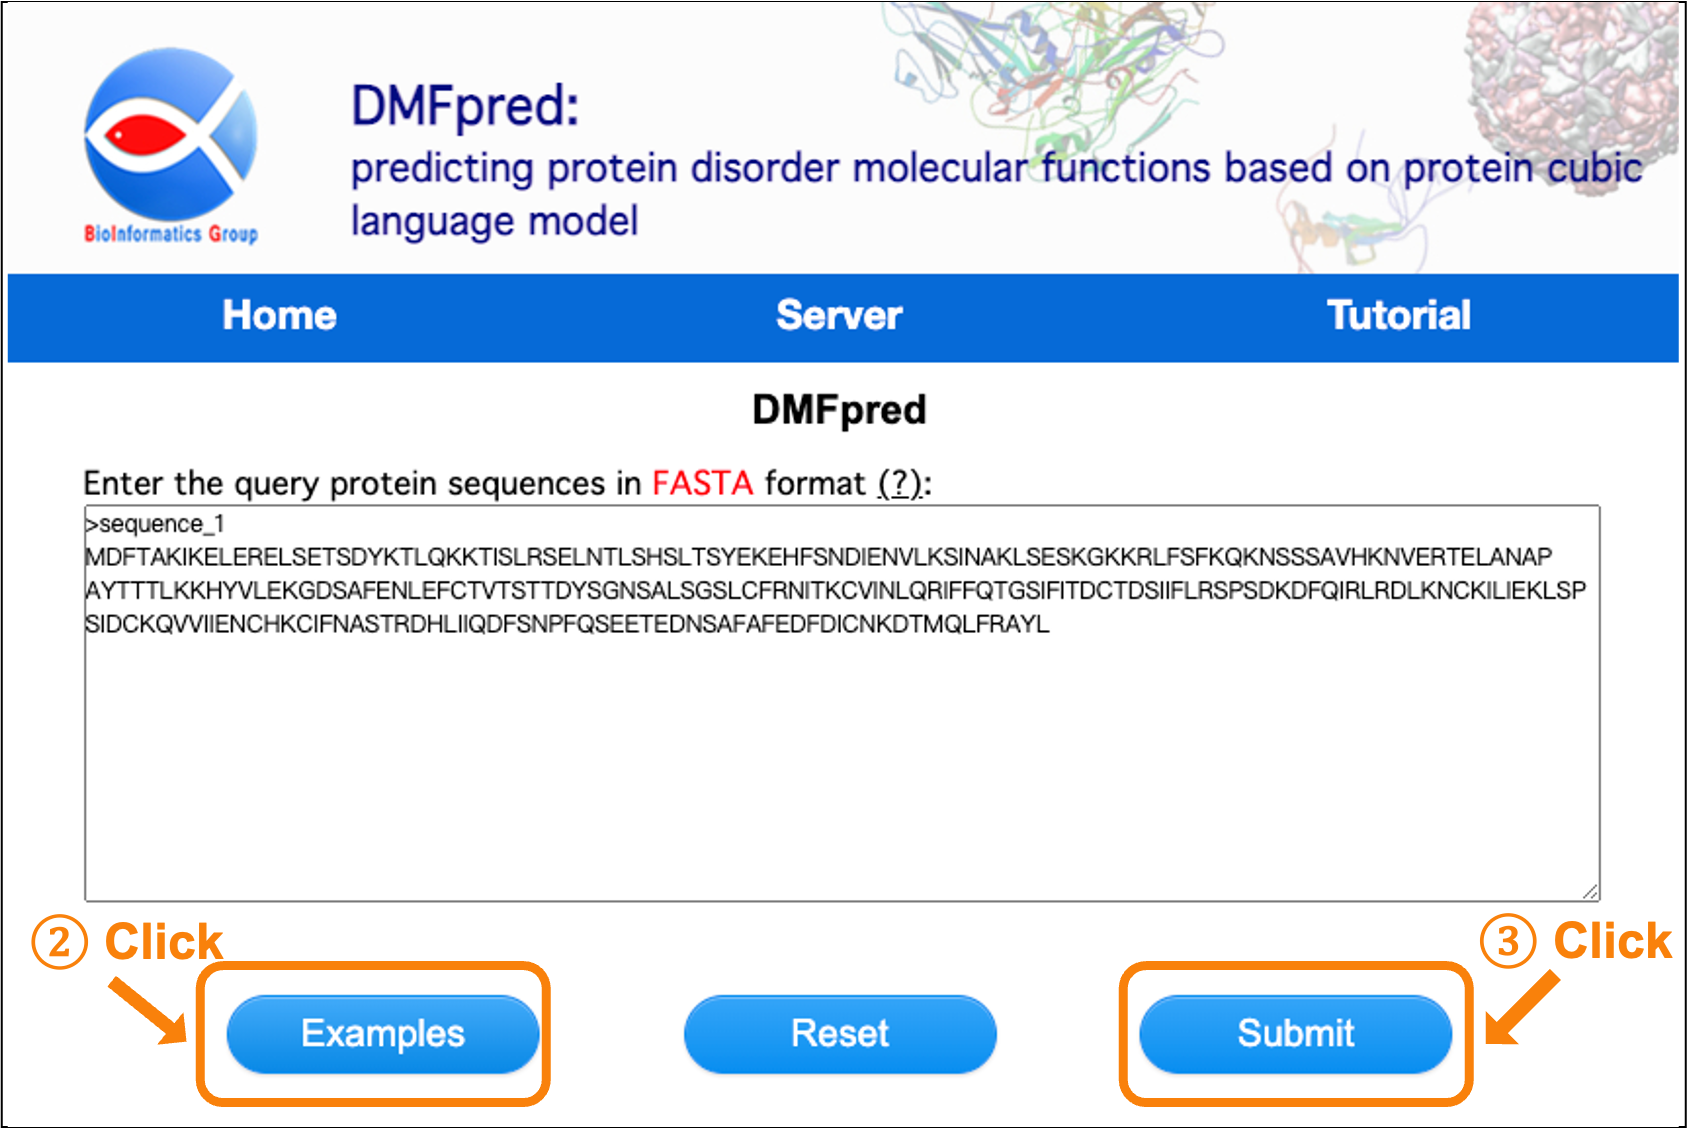
Figure 3. Screenshot of loading example protein sequences.
3. Waiting for the calculation results:
After submitting your analysis data, wait a few minutes until you get feedback on the calculation results.
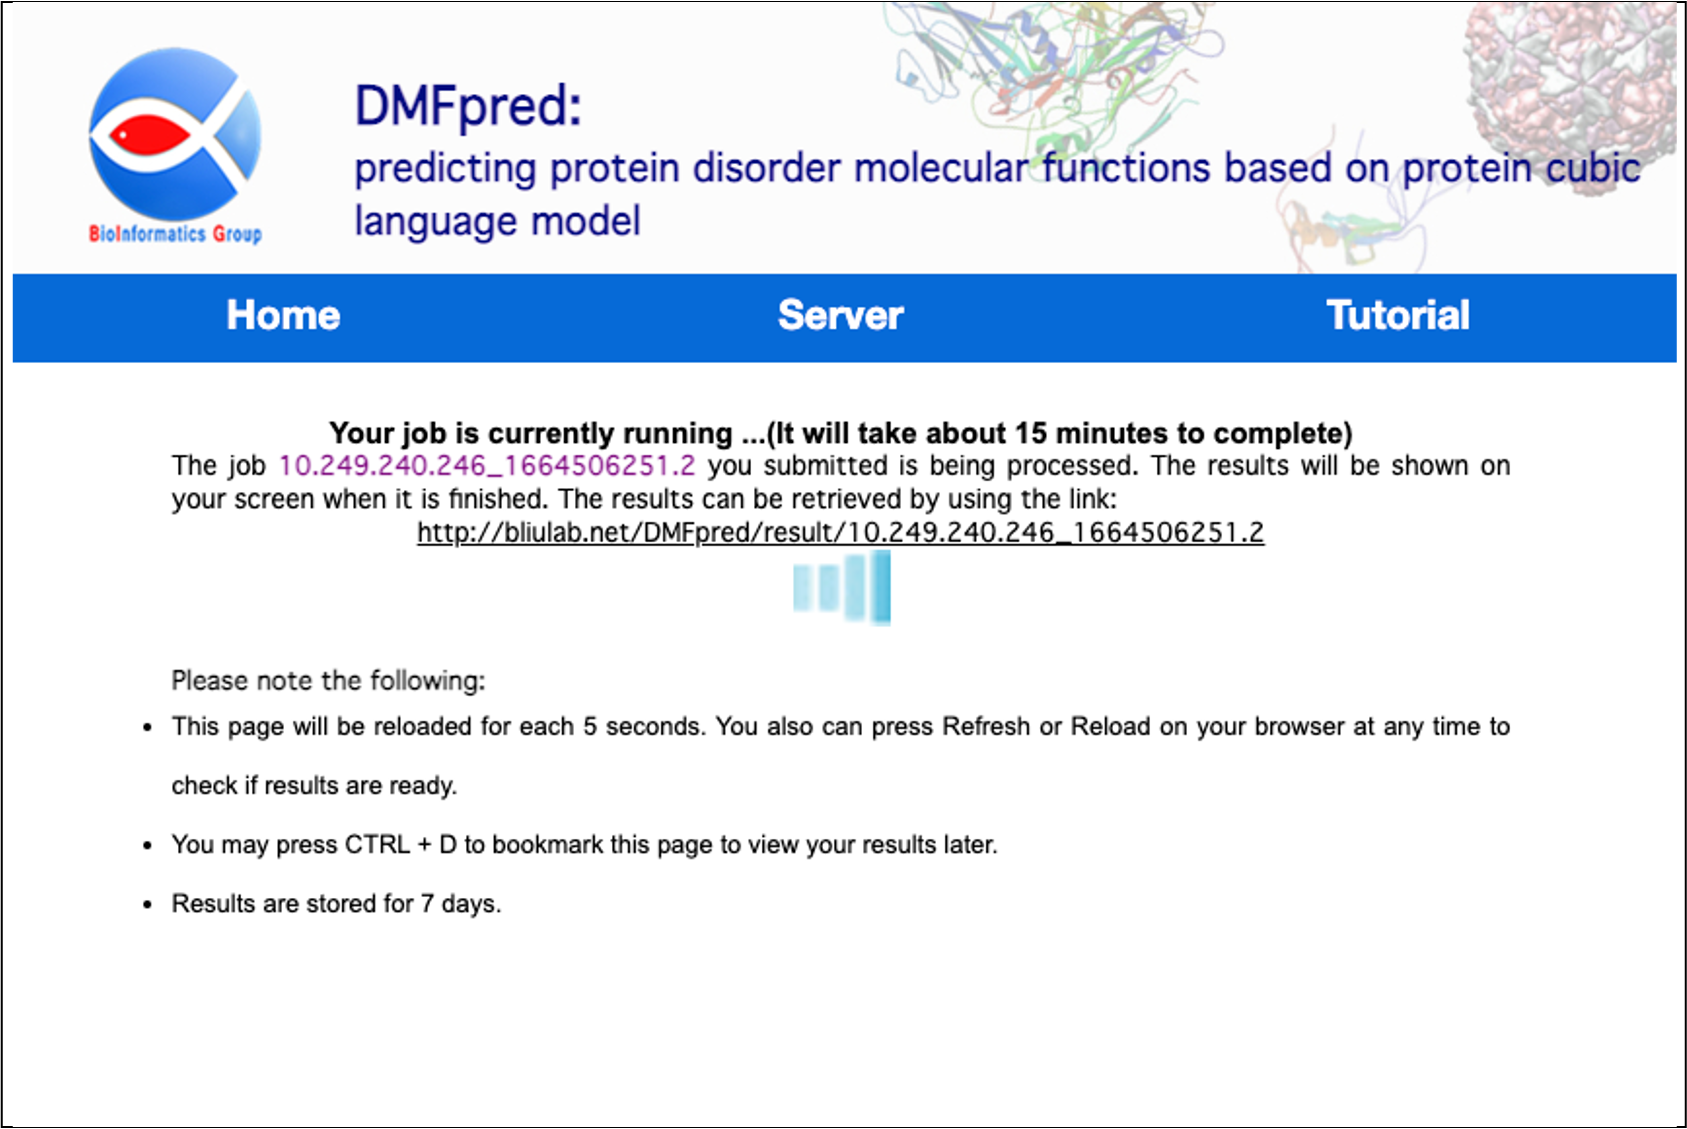
Figure 4. The processing waiting interface.
4. The prediction results:
After the calculation is completed, the results are directly shown in the interface. You can click the "sequence_n" button to select the sequence results to display, and select the functional results to display in the "functional category" drop-down menu.
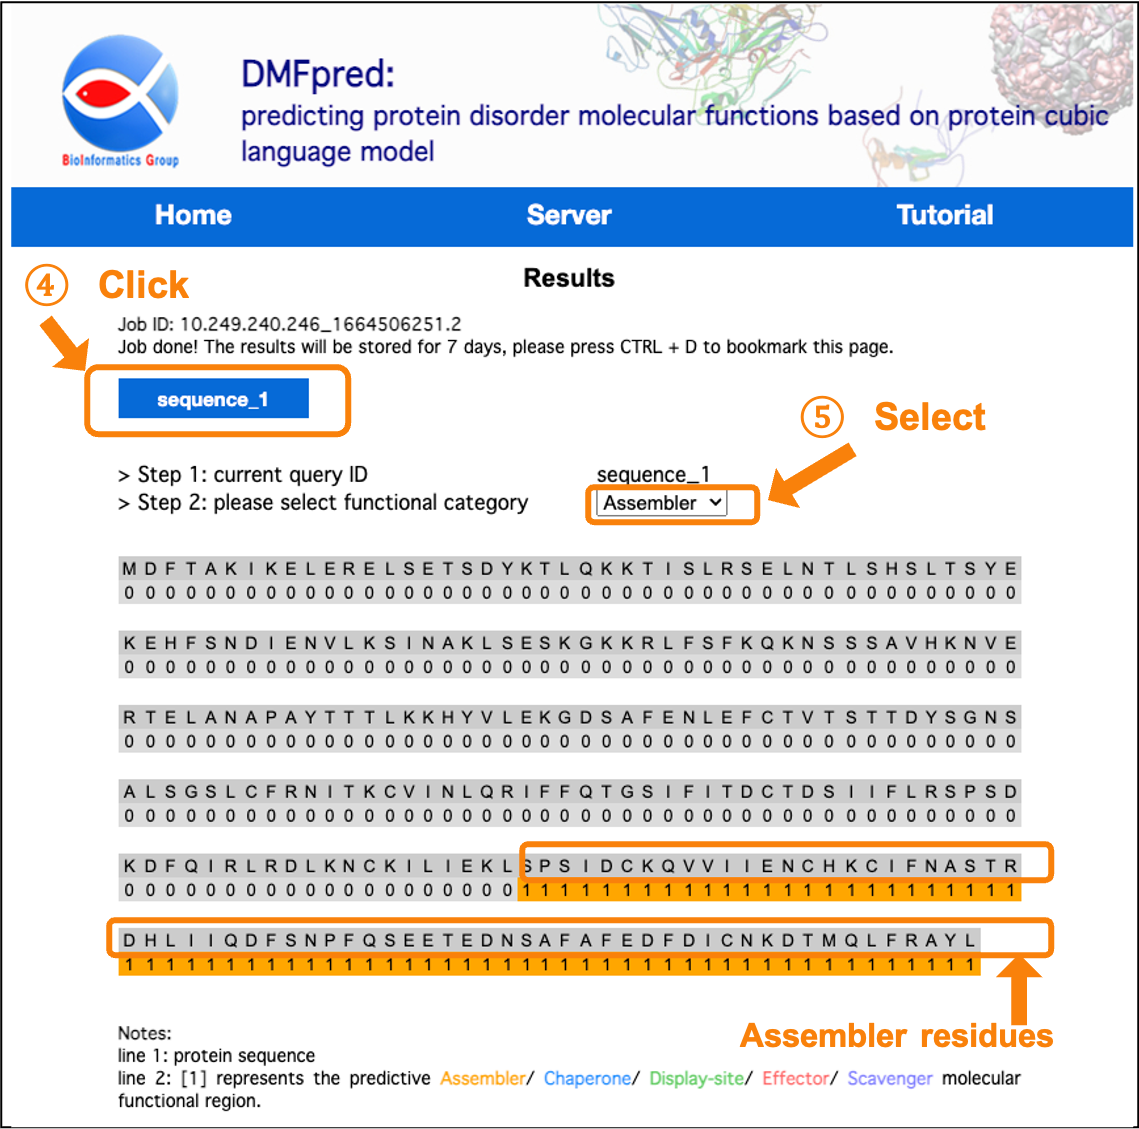
Figure 5. The prediction results for disordered assembler functional residues.
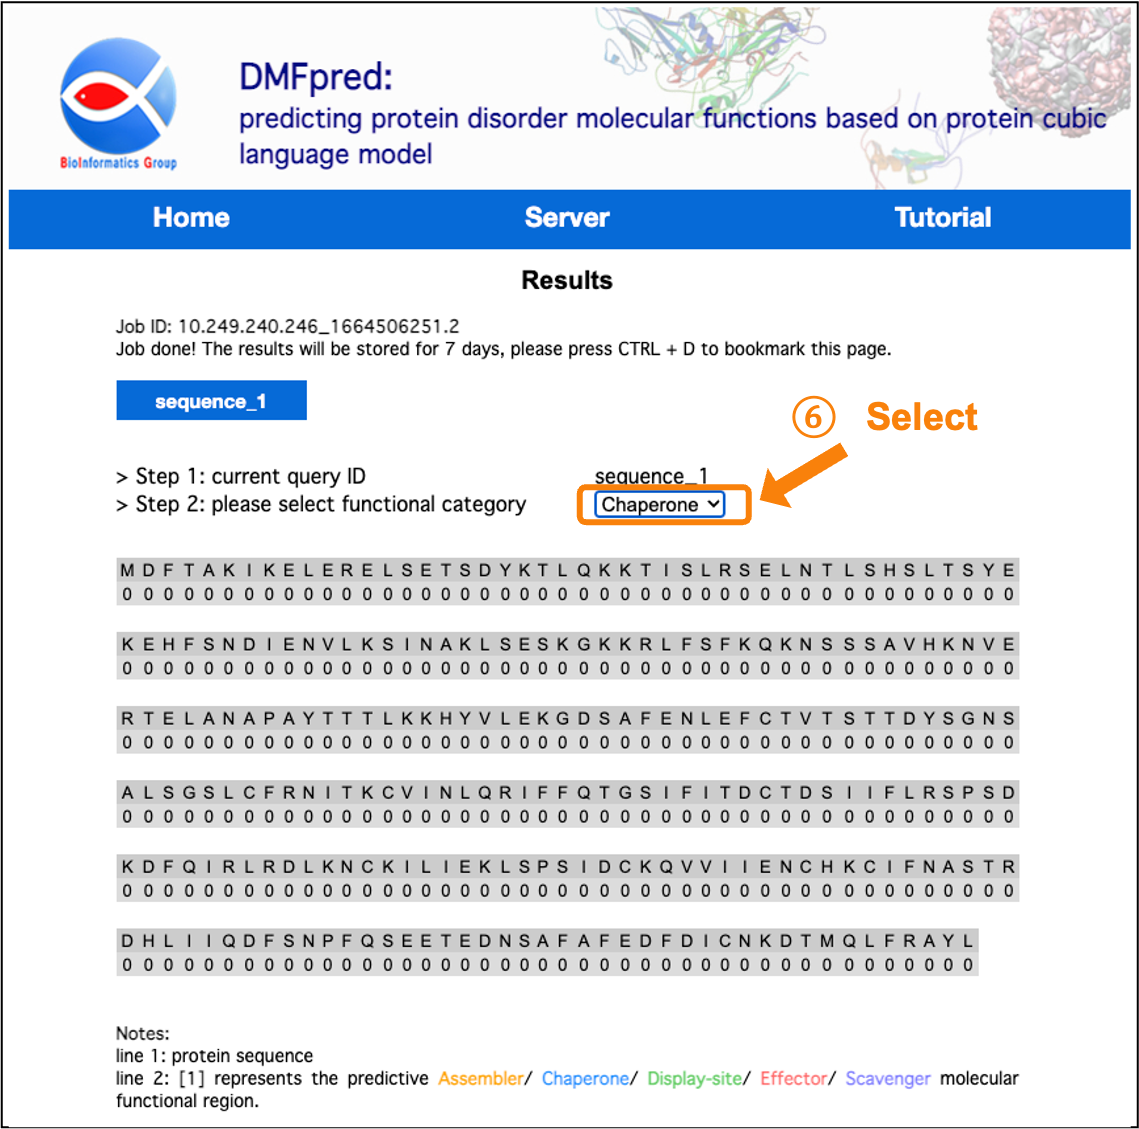
Figure 6. The prediction results for disordered chaperone functional residues.
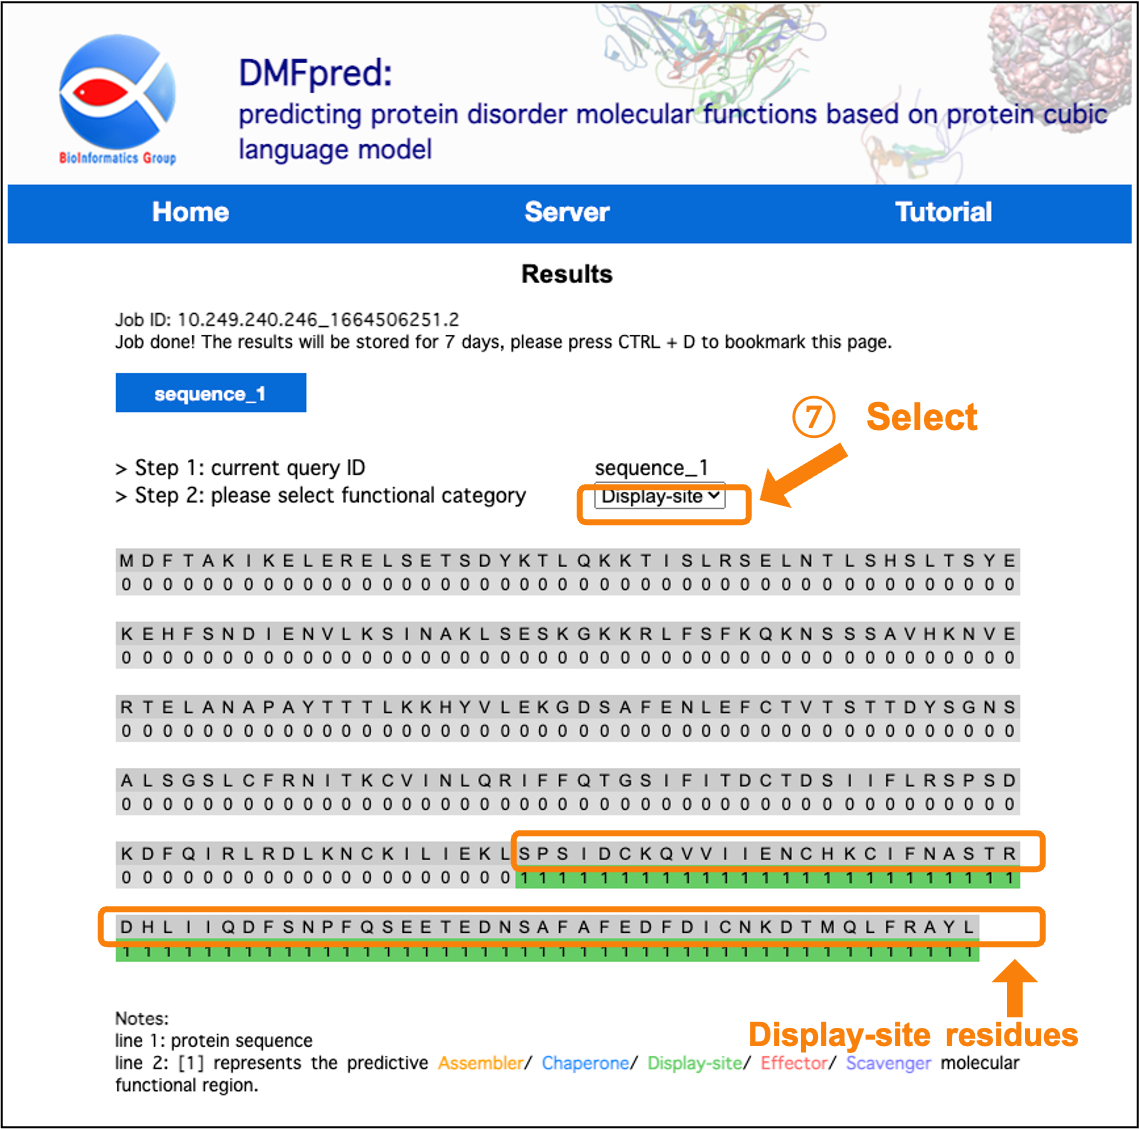
Figure 7. The prediction results for disordered display-site functional residues.
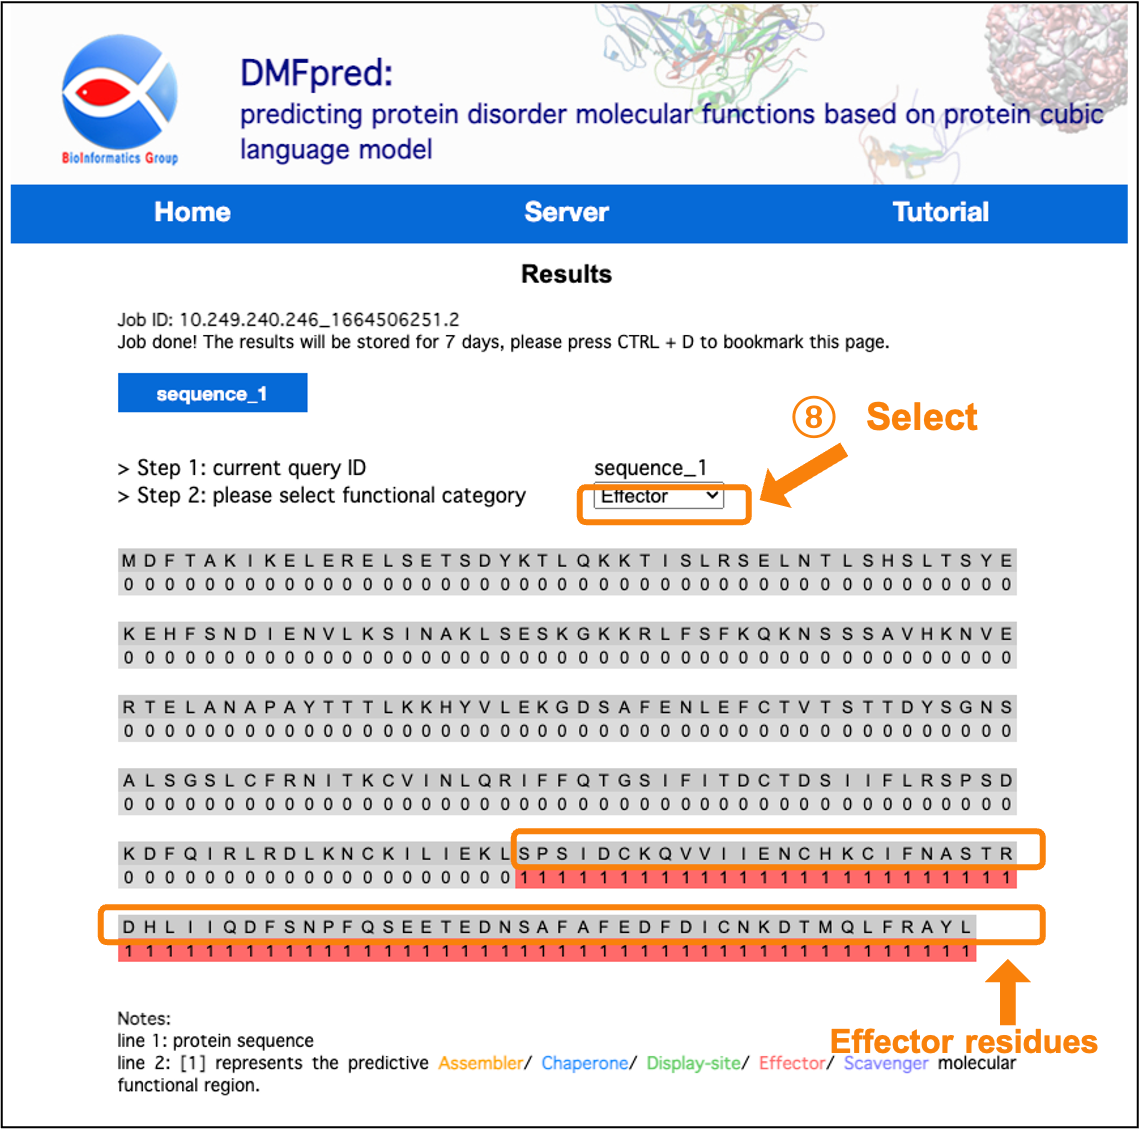
Figure 8. The prediction results for disordered effector functional residues.
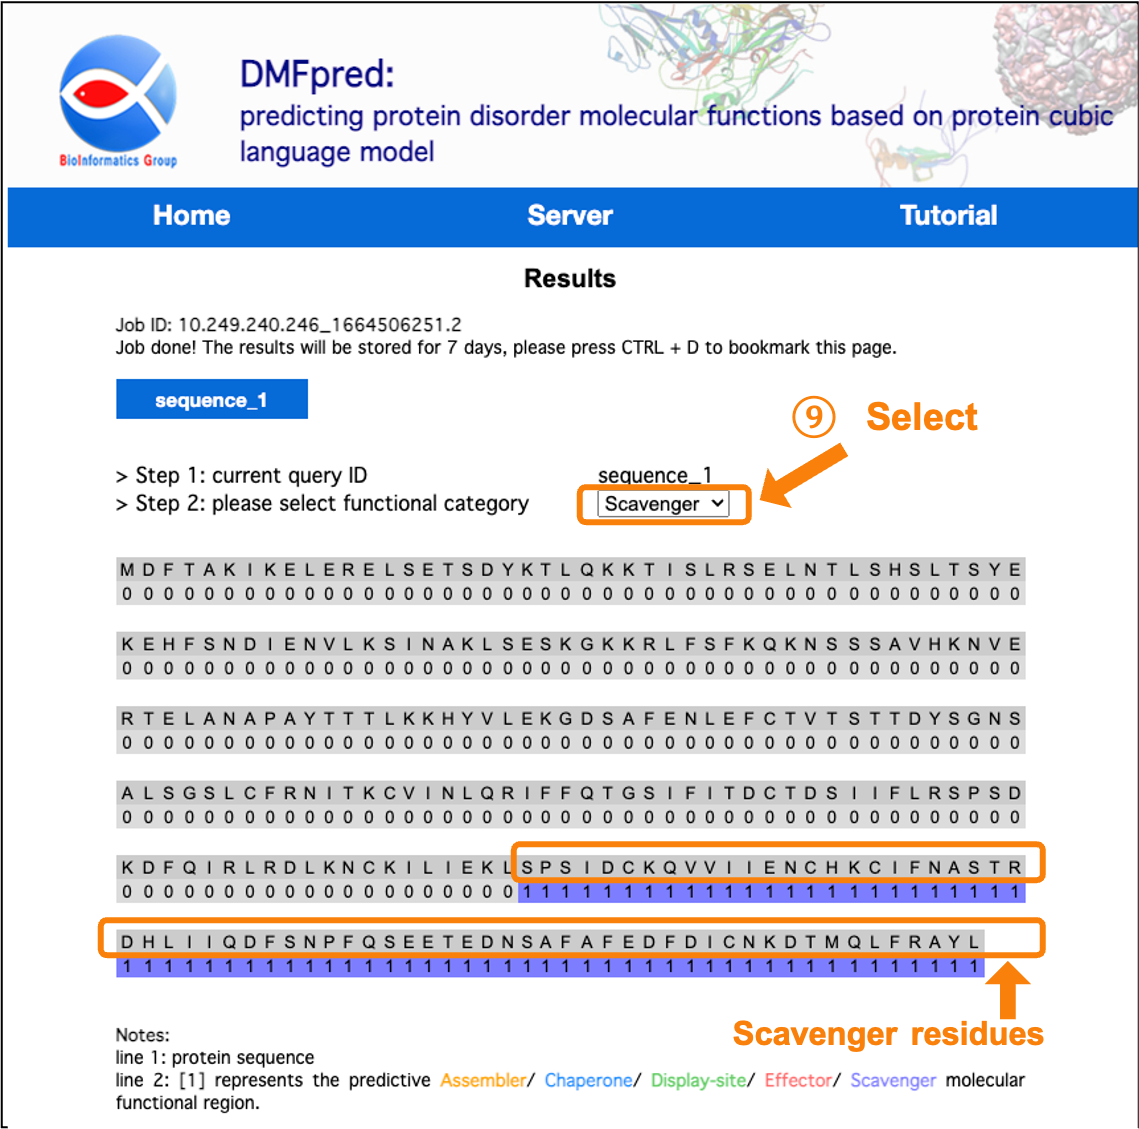
Figure 9. The prediction results for disordered scavenger functional residues.
5. Download the binary prediction results:
Click on the text hyperlink to download the binary prediction results in TXT format.
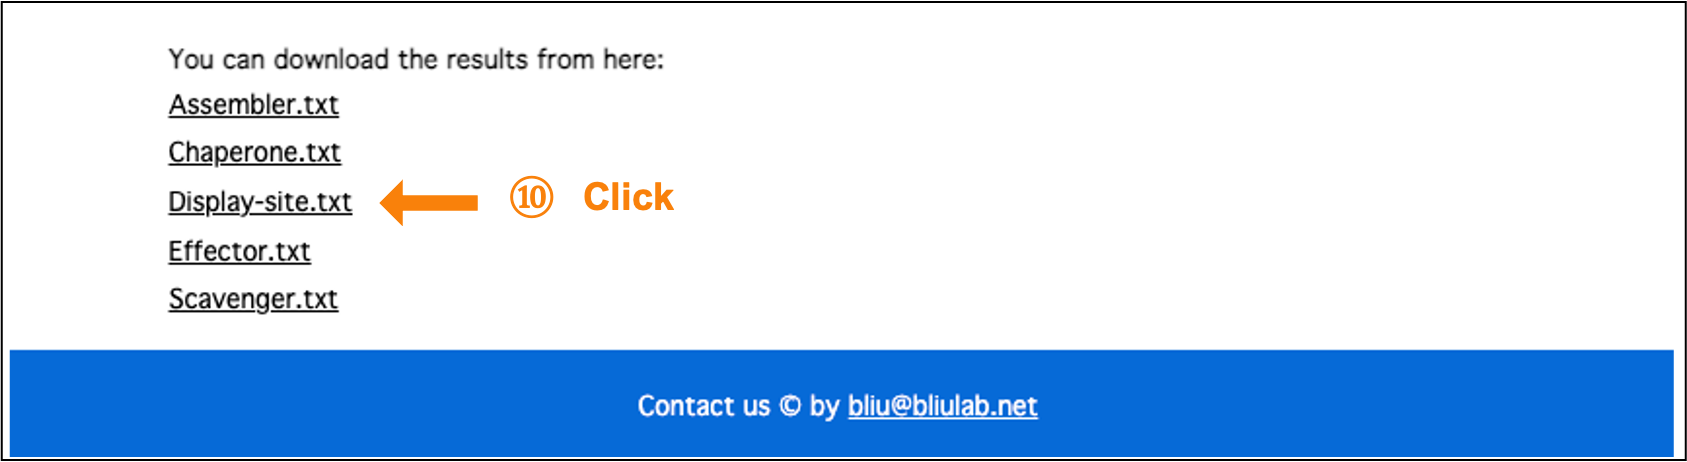
Figure 10. Download the binary prediction results.