BioSeq-Analysis2.0: an updated platform for analyzing DNA, RNA, and protein sequences at sequence level and residue level based on machine learning approaches |
For the convenience of the vast majority of experimental scientists, a step-by-step guide on how to use the Bioseq-Analysis2.0 web server to get their desired results without the need to follow the complicated mathematic equations is given below.
Visit the web-server by clicking the link at http://bliulab.net/BioSeq-Analysis2.0/server and you will see the page as shown in Fig. 1.The three figures represent three sub web servers: DNA-Analysis2.0, RNA-Analysis2.0, and Protein-Analysis2.0 for DNA, RNA, and protein sequences analysis, respectively.
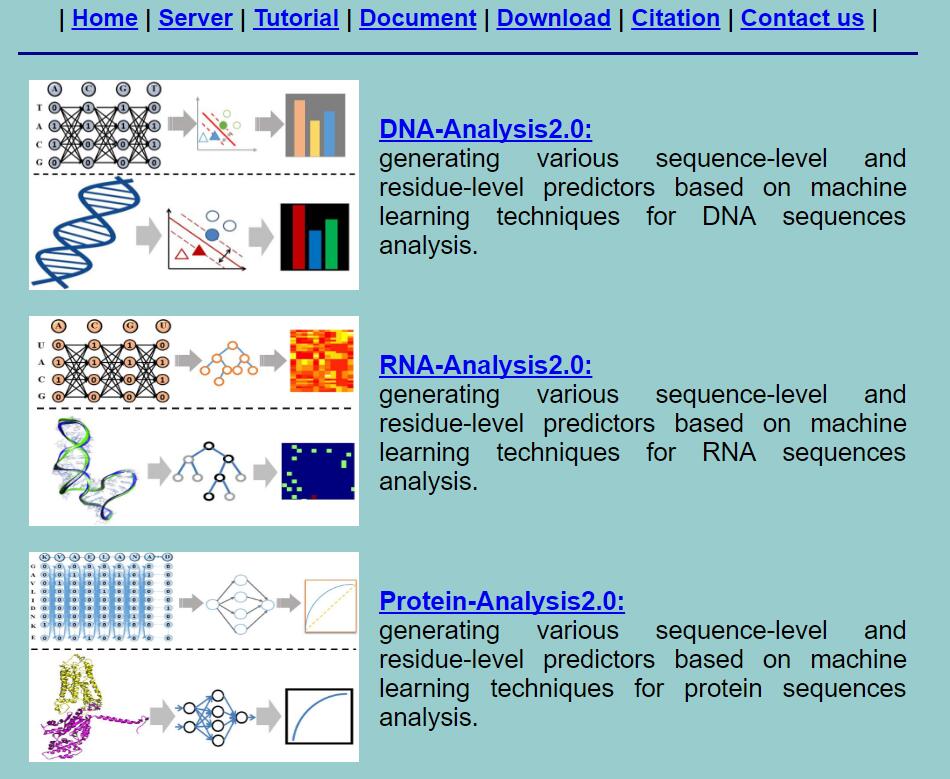
Fig. 1
An example for constructing residue-level predictors by usingBioseq-Analysis2.0
Step 1. If you click the Protein-Analysis2.0 (see Fig. 1), then you will see its homepage as shown in Fig. 2 .
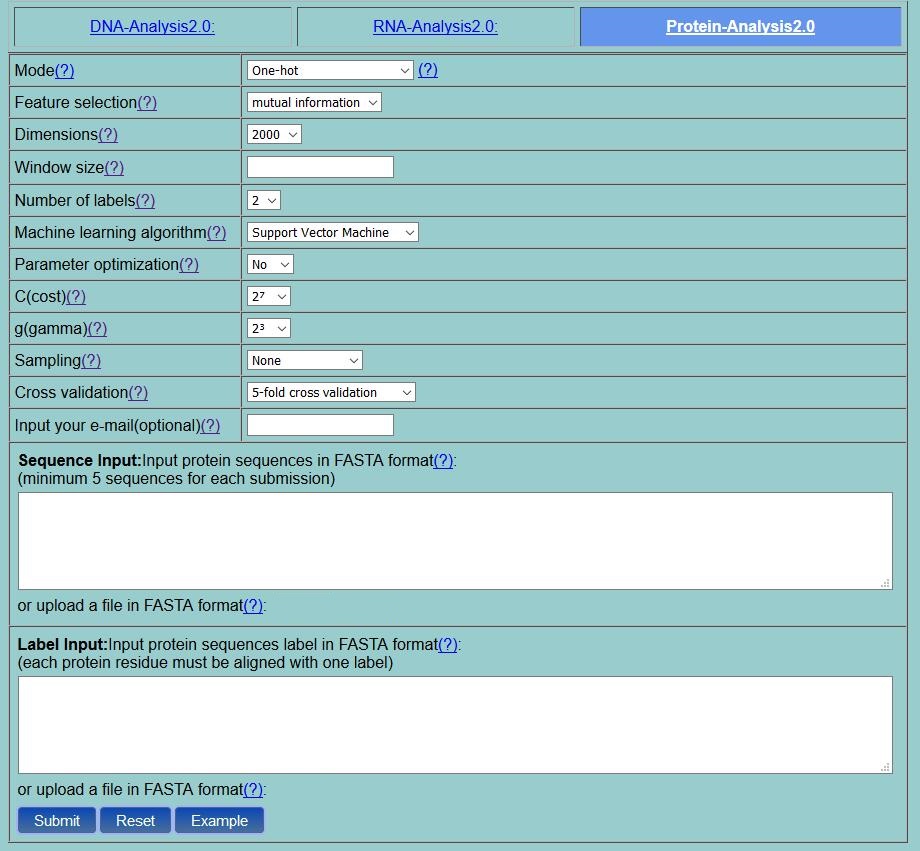
Fig. 2
Step 2. Select one mode from the 13 residue-level methods listed in the pull-down menu, and its corresponding parameters will be shown. You can click the "?" for the help information of various methods and their parameters. For example, if you select the One-hot method, you will see the page as shown in Fig. 3 .If you set the number of labels as 2, a binary classification task, and you need to input two kinds of labels via the Label Input box. One of the three machine learning algorithms can be used as the classifier: Support Vector Machine, Random Forest and Conditional Random Field. The parameters of the classifiers can be automatically by selecting the "Parameter optimization" option according to the provided performance measure by using the "Performance measure" option. ACC is the default performance measure for parameter optimization. Two cross validation methods are provided, including 5-fold cross-validation, independent test. Here, the 5-fold cross-validation was employed. The "Window size" is the size of the sliding window, which was set as 7 in this example. You can either type or copy and paste the protein sequences into the Sequence Input box or directly upload your input data by clicking the Choose File button. The input sequences should be in the FASTA format. You can just click the button Example to input the built-in sequence examples with default parameter setting as shown in Fig. 3 .
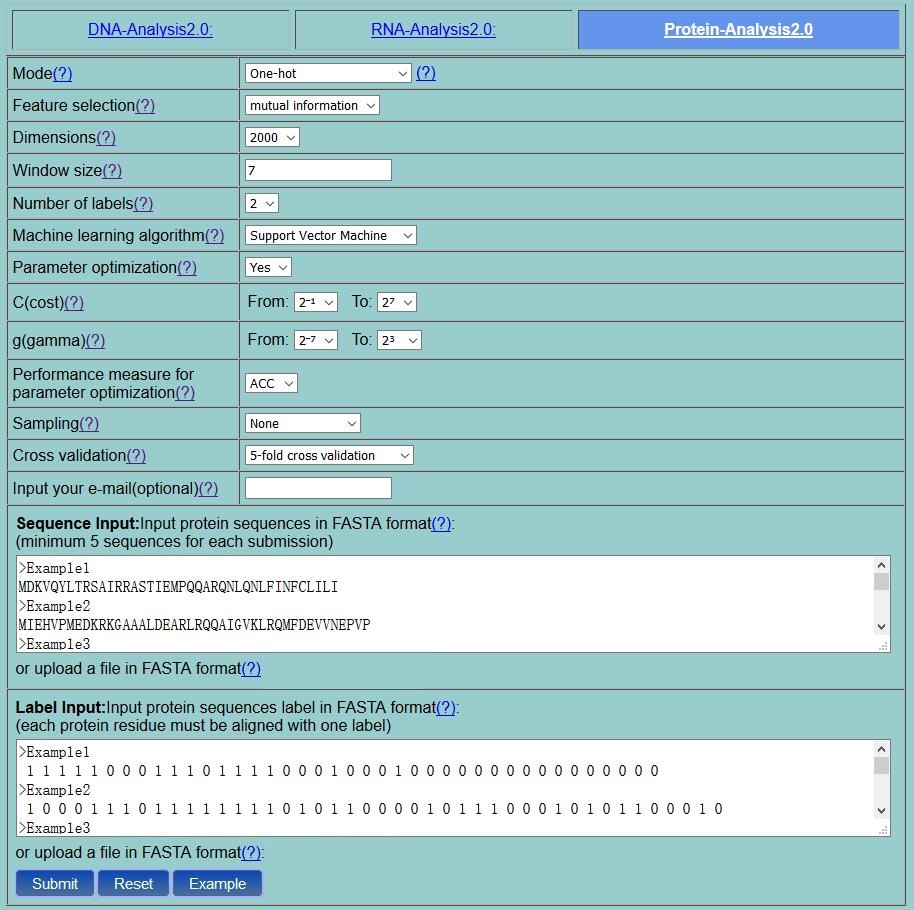
Fig. 3
Step 3. If you just click the button Example in the Step 2, and then click the Submit button, you will see a result page as shown in Fig.4. "Parameter Summary" shows the basic information of the mode and machine learning classifier used in the process and tand the corresponding parameters. The performance measures of the corresponding predictor will also be given along with the ROC curve (only for binary classification task). Besides, you can click the Download button to download the feature vectors in a text file.
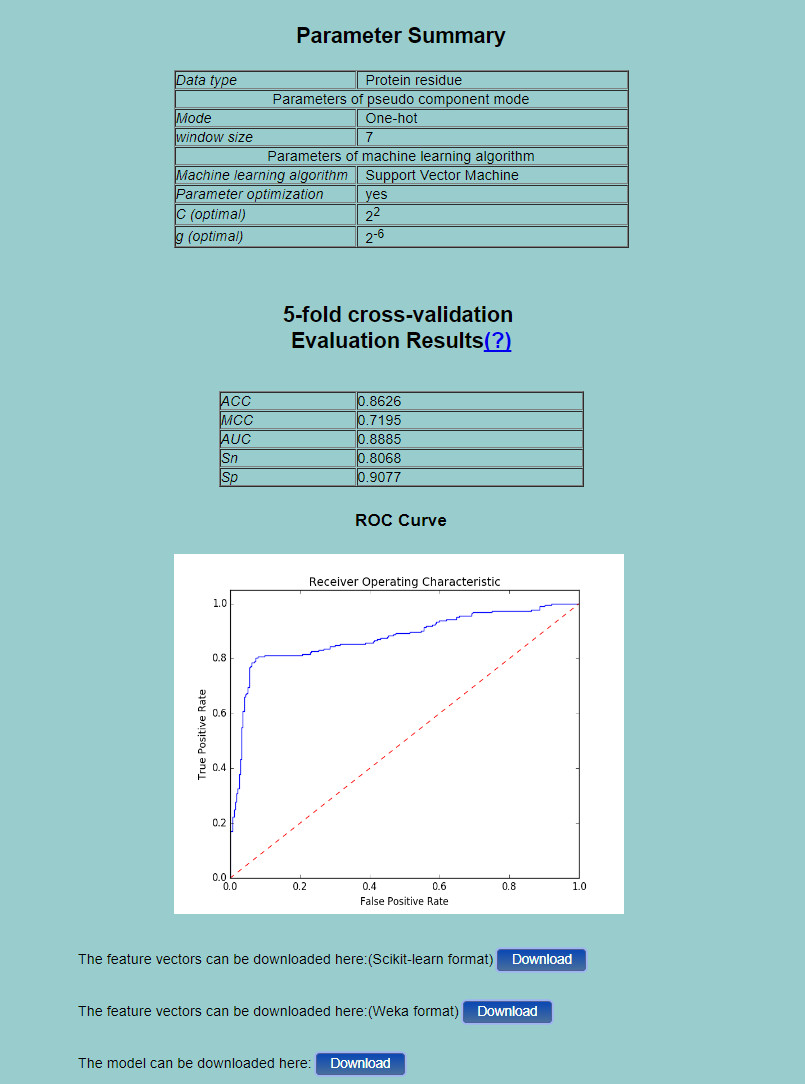
Fig. 4
An example for constructing sequence-level predictors by usingBioseq-Analysis2.0
Step 1. If you click the Protein-Analysis2.0 as shown in Fig. 1, then you will see its homepage(see Fig. 5).
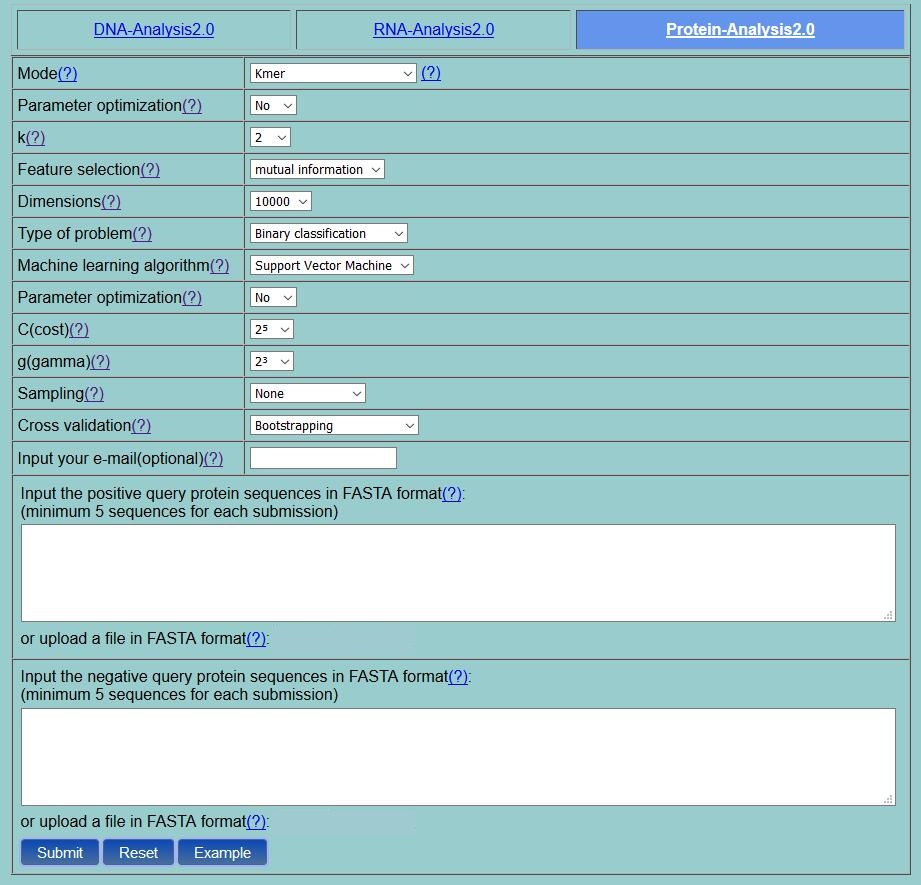
Fig.5
Step 2. Select one mode from the 20 sequence-level modes listed in the pull-down menu, its corresponding parameters will be shown. You can click the "?" for the help information of various methods and their parameters. For example, if you select the Kmer, you will see its homepage as shown in Fig. 6.The parameter K in kmer can be automatically optimized by set the "Parameter optimization" as "Yes". If you set the type of problem as "Binary classification", then two input boxes for positive dataset and negative dataset will be shown. One classifiers can be selected from Support Vector Machine, Random Forest, OET-KNN and Covariance Discriminant and its corresponding parameters can be automatically optimized by setting the "Parameter optimization" option as "Yes" according to the performance measure provided by performance measure" option (ACC is the default value). Three cross validation methods are provided, including 5-fold cross-validation, independent test, and bootstrapping. You can either type or copy and paste the dataset into the input boxes or directly upload your input data by clicking the Choose File button. The input sequences should be in the FASTA format. You can just click the button Example to input the built-in sequence examples with default parameter setting as shown in Fig. 6 .
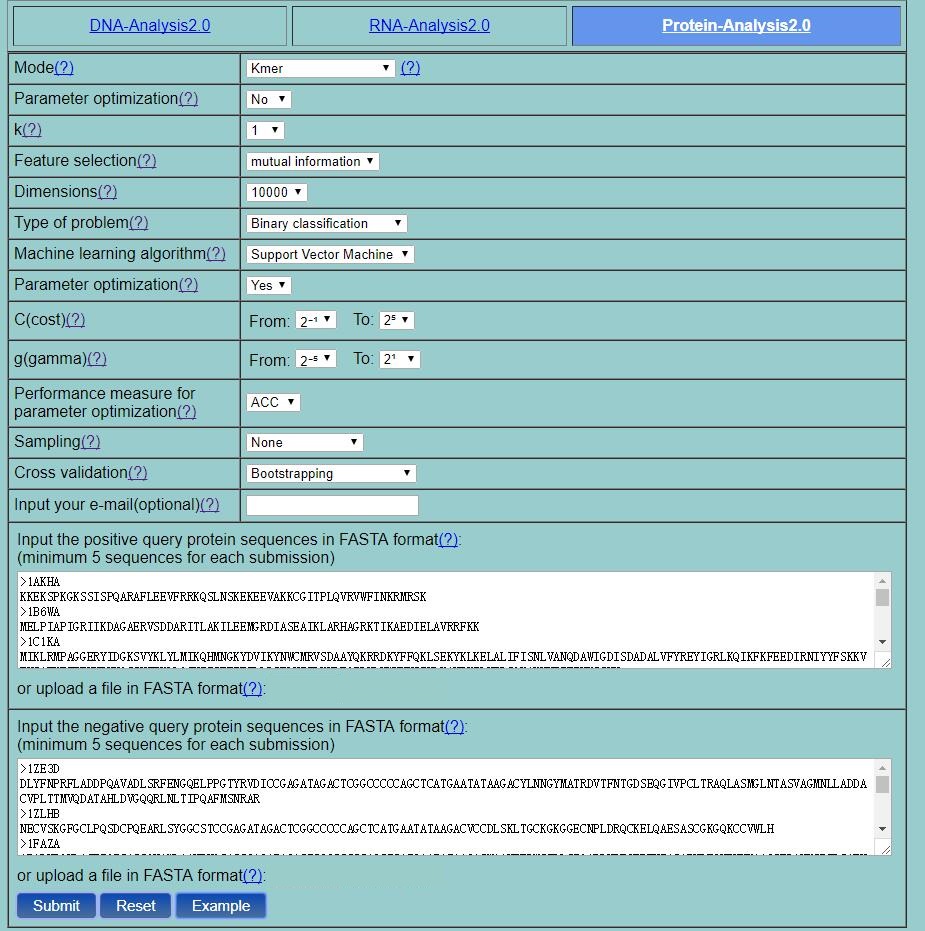
Fig. 6
Step 3. An example will be given by clicking the Example button. If you use the example and click the Submit button, you will see a result page as shown in Fig.7 ."Parameter Summary" shows the basic information of the mode and machine learning classifier used in the process and the corresponding parameters. The performance measures of the corresponding predictor will also be given along with the ROC curve (only for binary classification task). Besides, you can click the Download button to download the feature vectors in a text file.
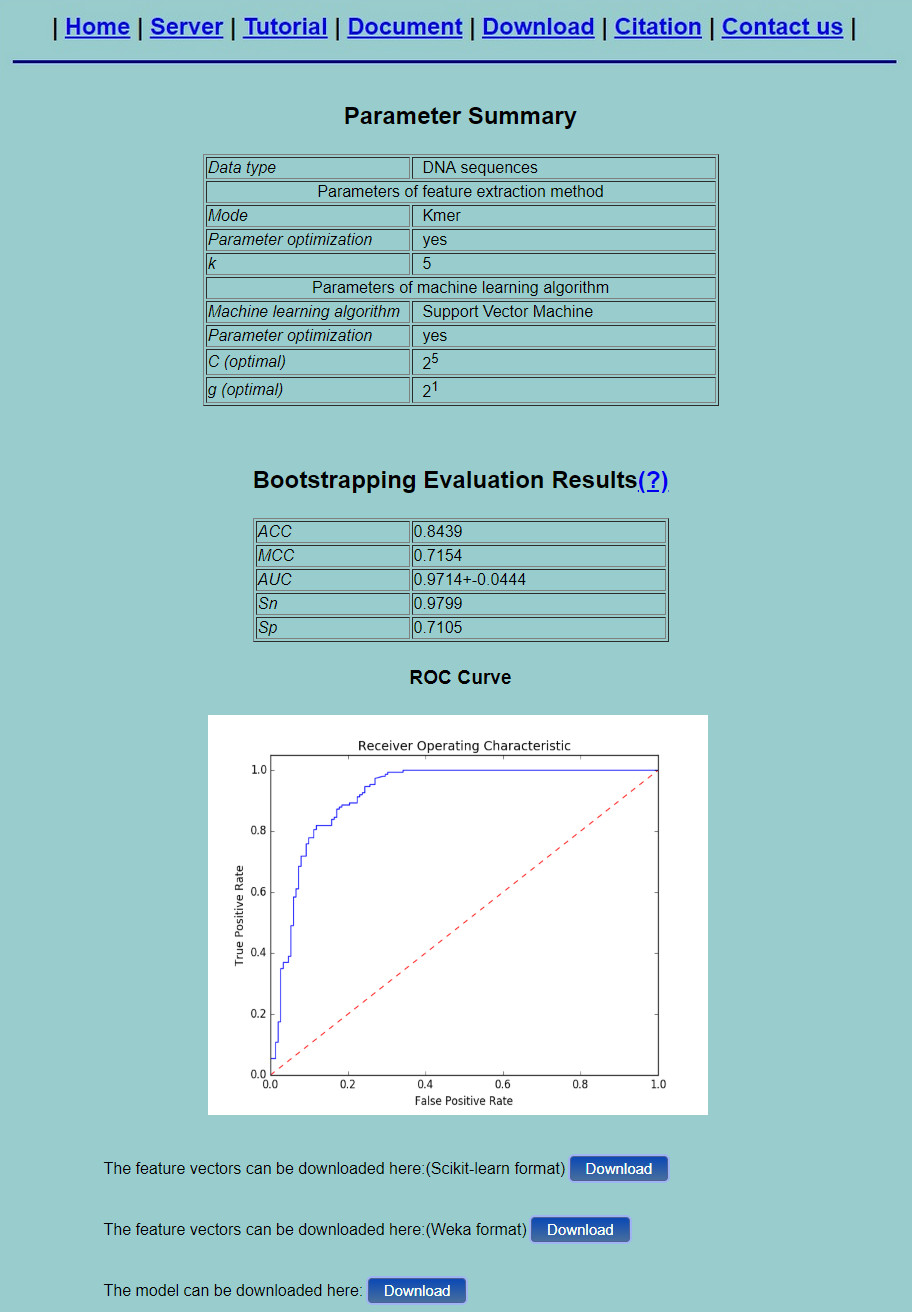
Fig. 7
Applications of BioSeq-Analysis2.0
In this section, BioSeq-Analysis2.0 standa-lone tool was applied to three important residue-level biological sequence analysis tasks, including protein disordered region prediction,enhancer prediction,and mRNA N6-methyladenosine (m6A) site prediction. The predictors for these tasks can be easily generated using BioSeq-Analysis2.0. Particularly, the performance of some predictors automatically generated by BioSeq-Analysis2.0 is highly comparable or even better than the existing predictors, indicating that BioSeq-Analysis2.0 is a powerful tool for generating new predictors for analyzing biological sequence tasks.
Enhancer is short DNA region that can be bound by proteins (activators) to activate a gene transcription (1). Therefore, the identification of enhancers is important for studying the transcription process, which can be regared as a binary classification task. In this study, the DNA-Analysis2.0 was used to generate 14 different predictors for enhancer prediction based on the 7 residue-level feature extraction methods for DNA sequences, and two machine learning algorithms: SVM and RF.
Run the following command for generating each predictor easily:
" python analysis.py sequence_file DNA -method feature_extraction_method -ml machine_learning_method -labels label_file -fragment 1 -model model_name"
Evaluated on a widely used benchmark dataset (1)(2), the ROC curves of the 14 predictors were listed in Fig. 8, from which we can see that the SVM-One-hot predictor achieves the top performance with an AUC score of 0.8267, even outperforming the existing approach reported in EnhancerPred (3), indicating that BioSeq-Analysis2.0 is useful for generating new predictors for enhancer identification.
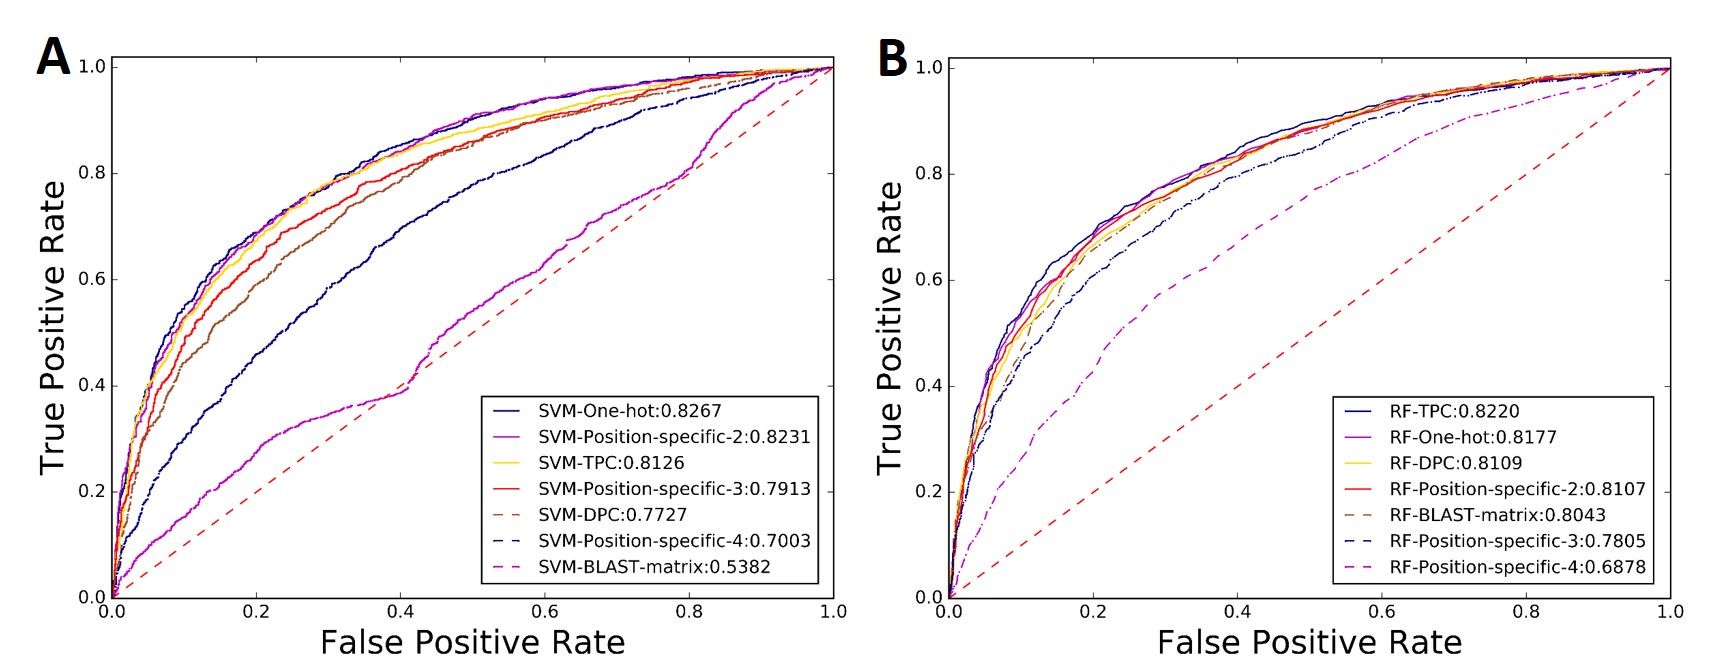
Fig.8
Identification of mRNAs (m6A) sites
N6-Methyladenosine (m6A) is an RNA methylation modification at the nitrogen-6 position of the adenosine base (4). Research in cancer biology has shown that m6A mRNA modification plays a critical role in glioblastoma stem cell self-renewal and tumorigenesis. Therefore, the identification of the m6A becomes a hot topic.
In this study, the RNA-Analysis2.0 in BioSeq-Analysis2.0 was used to generate 12 different predictors for mRNAs (m6A) site prediction based on the 6 residue-level feature extraction methods, and two machine learning algorithms: SVM and RF.
Run the following command for generating each predictor easily:
" python analysis.py sequence_file RNA -method feature_extraction_method -ml machine_learning_method -labels label_file -fragment 1 -model model_name "
Fig.9 shows the ROC curves of the 12 predictors automatically generated by BioSeq-Analysis2.0. These experimental results further confirmed that RNA-Analysis2.0 was useful for developing new predictors for analyzing RNA sequence tasks as well.
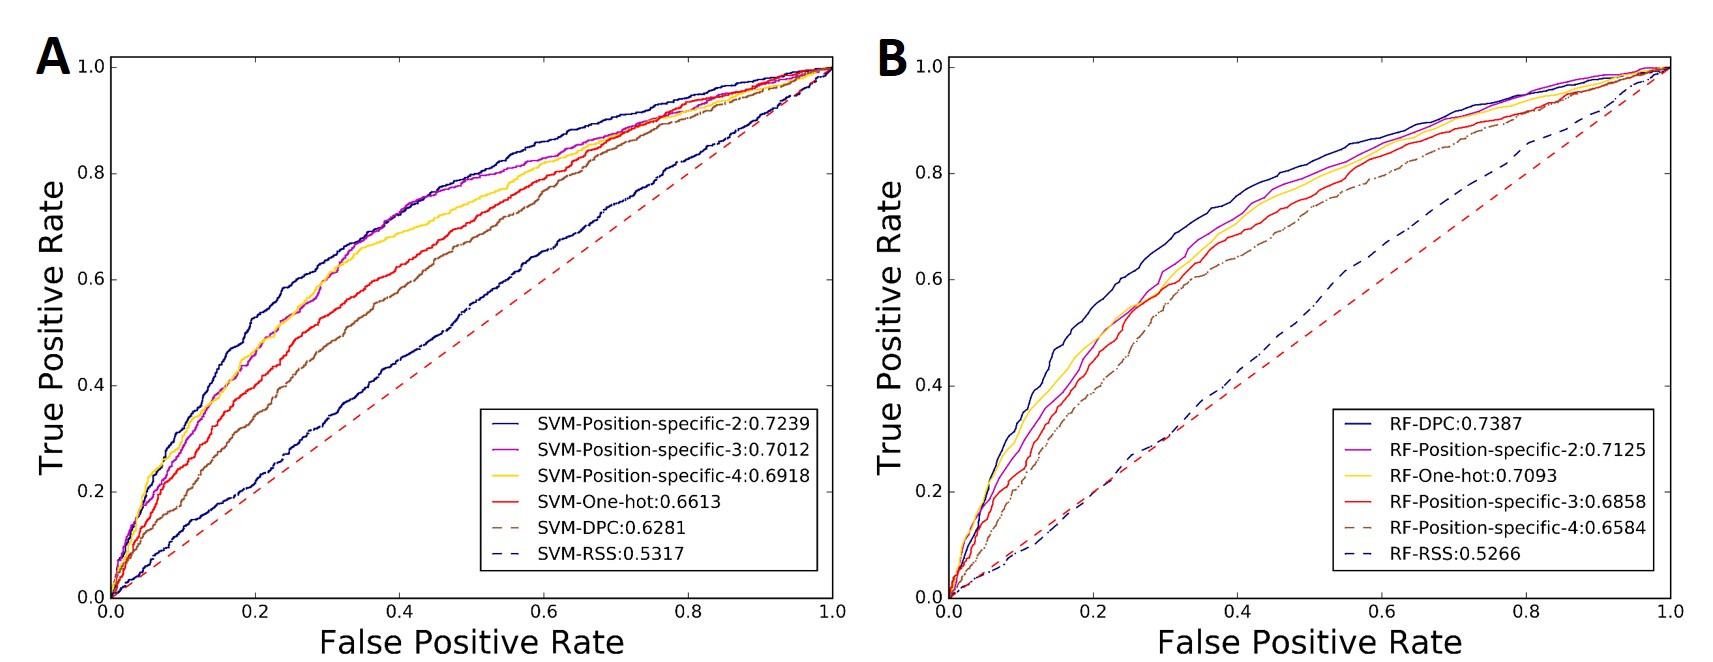
Fig.9
Identification of protein disordered regions
Intrinsically disordered proteins are protein that lack stable three dimensional structures in their native states (5), which are correlated with many diseases, such as genetic diseases, cancer, etc. Therefore, identification of disordered proteins and regions has become one of the most popular tasks in the studies of protein structures and functions .
Here, Protein-Analysis2.0 in BioSeq-Analysis2.0 was used to automatically generate various predictors for protein disordered region prediction based on the benchmark dataset (5).
Finally, 26 predictors were generated based on the 13 residue-level feature extraction methods of proteins, and two machine learning algorithms: CRF and SVM.
Run the following command for generating each predictor easily:
" python analysis.py sequence_file Protein -method feature_extraction_method -ml machine_learning_method -labels label_file -model model_name -size sliding_window_size "
The ROC curves of the 26 predictors were shown in Fig. 10, where we can see that the feature extraction methods and machine learning algorithms have an influence on the performance of the corresponding predictors, and the predictors based on the sequence labelling model CRF generally outperformed those based on the SVM, which is fully consistent with a recent study. Particularly, the CRF-One-hot (6-bit) predictor can achieve an AUC score of 0.7472, highly comparable with the existing state-of-the-art methods in this filed.
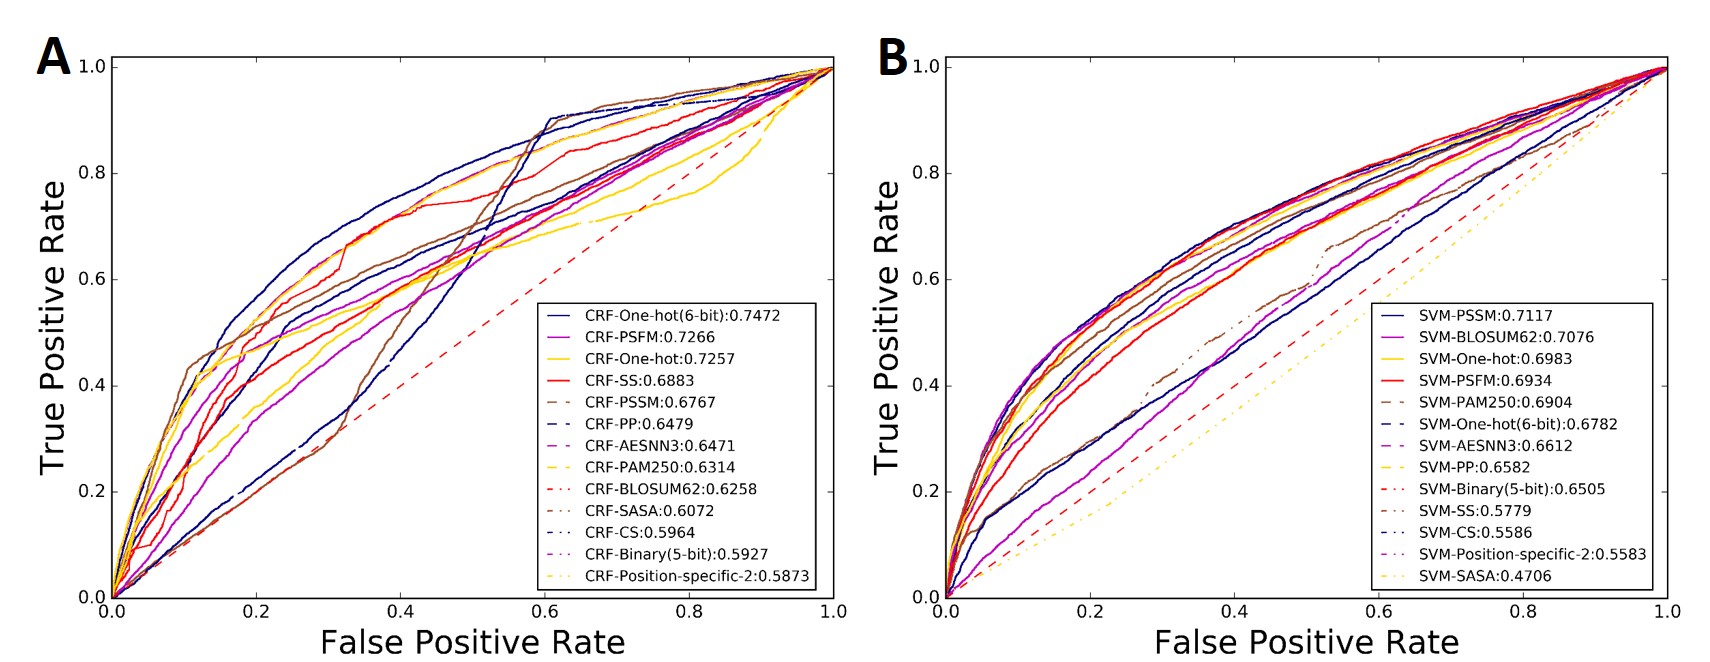
Fig.10