ProtDec-LTR 2.0An improved method for protein remote homology detection by combining pseudo protein and supervised learning to rank |
ProtDec-LTR 2.0An improved method for protein remote homology detection by combining pseudo protein and supervised learning to rank |
1. The flow chart of ProtDec-LTR 2.0
2. Profile-based pseudo protein sequence
3. The pseudo protein-based predictors
1. The flow chart of ProtDec-LTR 2.0 (back to content)
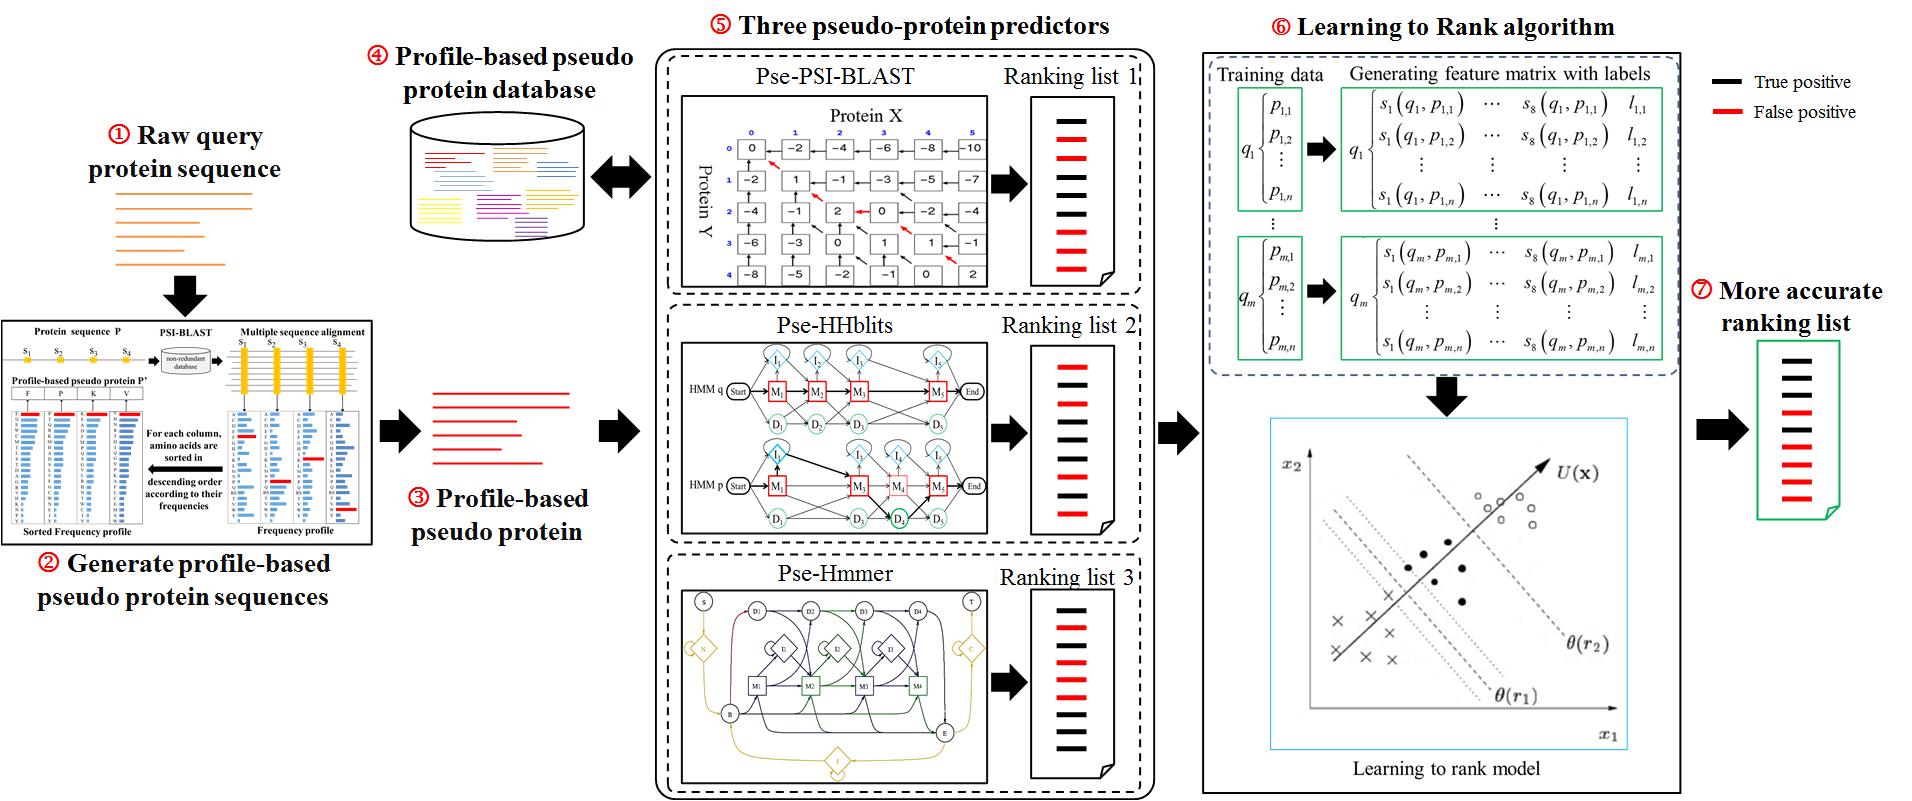
The flow chart of ProtDec-LTR 2.0 is shown in Fig. 1, in which there are three important modules for detecting remote homologous proteins.
The first module is to transform raw protein sequences into profile-based pseudo protein sequences as inputs for protein homology detection. In previous version, a protein sequence was directly input as a query [1]. However, the sequence identity among remote homologous proteins is usually low about at 35%. It is hard to achieve high sensitivity only according on raw protein sequences. This is a new module for ProtDec-LTR 2.0, by which it can incorporate conservation information during the evolutionary process.
The second one is to search the candidate remote homologous proteins in a large non-redundant database via basic ranking methods. In previous version, the searching was implemented by inputting raw protein sequence and searching against the raw protein sequence database. In the updated ProtDec-LTR 2.0, three pseudo-protein predictors (Pse-PSI-BLAST, Pse-HHblits and Pse-Hmmer) are constructed.
The third one is to refine the three basic ranking lists to produce a more accurate result by using supervised LTR algorithm. Three ranking lists are obtained by using the three basic pseudo-protein predictors, and then they are embedded as a feature matrix to input the framework of LTR. As a result, the three ranking predictors are combined in a supervised manner considering the advantages of all the three individual predictors for more accurate protein remote homology detection.
2. Profile-based pseudo protein sequence (back to content)
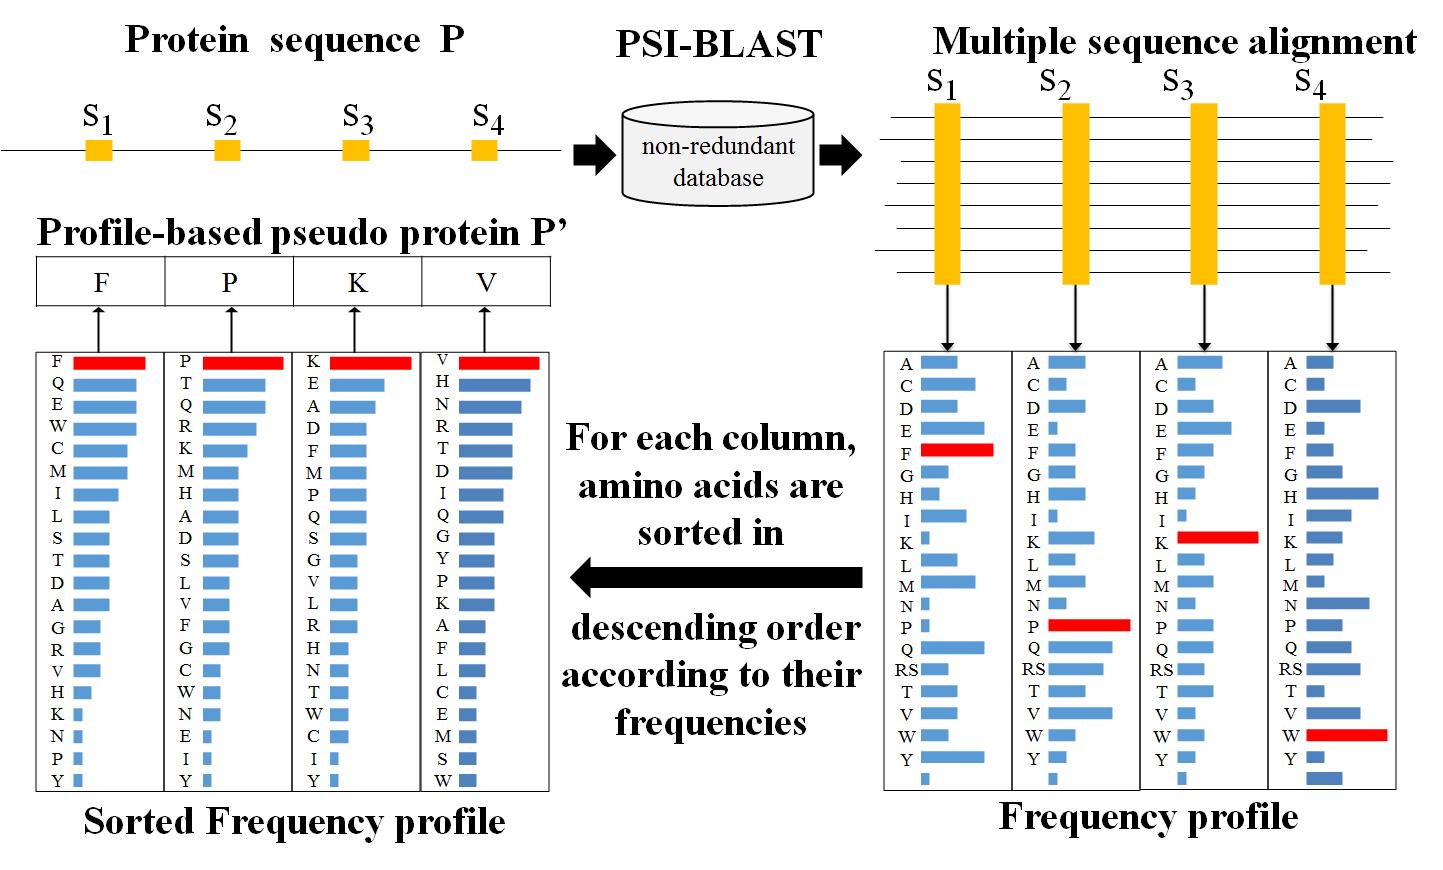
A profile-based pseudo protein sequence is not a real protein sequence. It is transformed from a profile of real protein sequence. As demonstrated in previous studies [2-4], profile-based pseudo protein sequences extracted from profiles are useful for improving protein remote homology detection. The main steps of generating the profile-based pseudo protein sequence are shown in Fig. 2 and simply descripted as following.
Firstly, for a protein sequence P, it is searched against the NCBI's nrdb90 [5] database by running PSI-BLAST [6] with parameters (-num_iteratives 3 -evalue 0.001) to generate a MSA. Then the frequency profile of sequence P, a matrix M of size 20*L (20 is the number of native amino acids and L is the length of sequence P), can be calculated based on the frequency of each amino acid at each site in generated MSA.
Secondly, for each column in M, we sort the amino acids in the descending order according to their frequency values, and then select the amino acids with the maximal frequency value in each column. These selected amino acids are combined to form a new pseudo protein sequence P’, which is called profile-based pseudo protein sequence.
The higher scores in M represent more conserved sites in protein sequence P. Such representation of proteins defined by frequency profiles would be more sensitivity than raw protein sequences for detecting remote homologs. The profile-based pseudo protein sequence P’ were used to replace the raw protein sequence P as input for protein homology detection.
3. The pseudo protein-based predictors (back to content)
In the updated ProtDec-LTR 2.0, we construct three pseudo-protein predictors (Pse-PSI-BLAST, Pse-HHblits and Pse-Hmmer) by combining the three state-of-the-art protein predictors (PSI-BLAST [6], HHblits [7] and Hmmer [8]) and profile-based pseudo protein sequence.
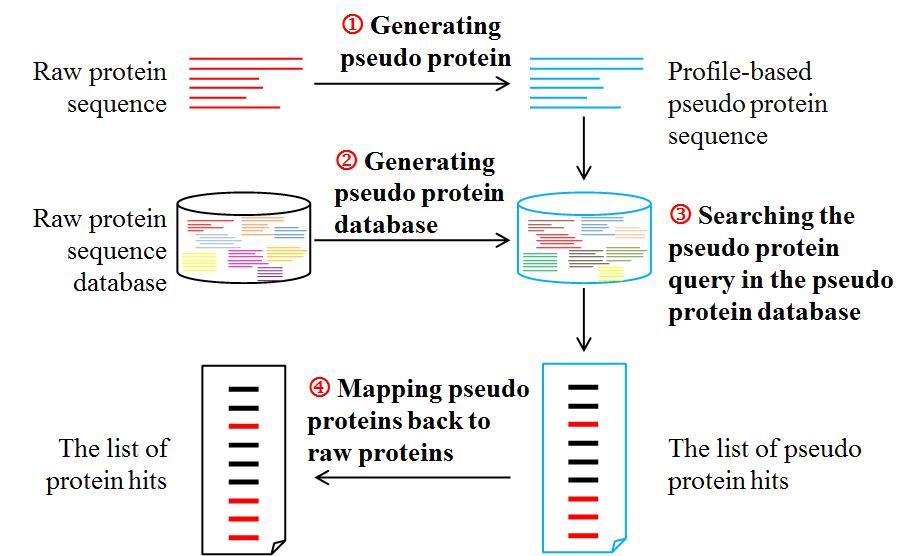
The protein predictors directly search a protein query in a protein database. However, each of the pseudo-protein predictor is fed into profile-based pseudo protein sequences generated at the first step, and the searching is performed against a pseudo-protein database in which the raw protein sequences are transformed into profiled-based pseudo protein in advance. The searching process of pseudo-protein predictor is as following:
The flowchart of searching process of pseudo-protein predictor is shown in Fig. 3. In this study, all the basic predictors were performed with default parameters.
4. Learning to rank (back to content)
Learning to rank [9] is the application of machine learning in the construction of ranking models for information retrieval systems, which has been successfully applied in many well-known searching engines, such as Bing [10] and Google [11]. The training data of learning to rank consists of lists of items with some partial order specified between items in each list. This order is typically induced by giving a numerical or ordinal score or a binary judgment (e.g. "relevant" or "not relevant") for each item. The ranking model's purpose is to rank, i.e. produce a permutation of items in new, unseen lists in a way which is "similar" to rankings in the training data in some sense. The training and testing phases of Learning to Rank was shown in Fig. 4.
Similar as the application of LTR in information retrieve, for protein remote homology detection, each protein sequence is treated as a "document". Three ranking lists are obtained by using the three aforementioned ranking methods, and then they are embedded as a feature matrix to train the LTR model. Finally, for an unseen query sample, its homologous proteins can be detected by the trained model of LTR. As a result, the three ranking predictors are combined in a supervised manner considering the advantages of all the three individual predictors for more accurate protein remote homology detection. For more information of LTR, please refer to [1].

Two benchmark datasets were used to evaluate the performance of predictors: SCOP [12] and SCOPe [13].
The SCOP benchmark dataset was constructed based on SCOP v1.59, which contains 7,329 proteins with less than 95% sequence identity. It is a widely used dataset, and it can provide good comparability with other related methods [1, 4]. There are 1,073 superfamilies and 1,827 families in this dataset.
The SCOPe benchmark dataset was constructed based on the SCOPe version v2.06 released on 06-April-2017 (the latest version), containing 28,010 proteins with less than 95% sequence identity with 2,008 superfamilies and 4,851 families.
6. The performance comparison (back to content)
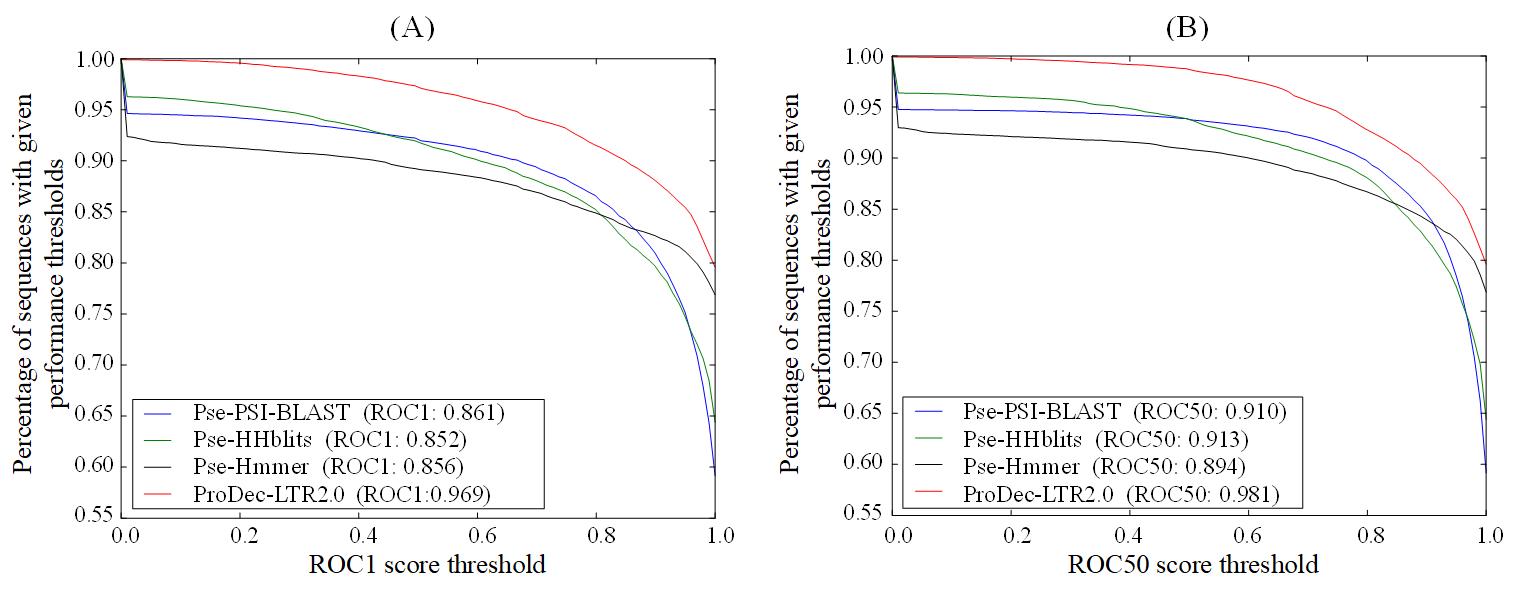
Two performance measures were employed to evaluate the performance of each method, including ROC1 score and ROC50 score [14]. ROC1 and ROC50 scores represent the area under ROC curve up to the first false positive and the 50th false positives, respectively. A score of 1 means perfect prediction, whereas a score of 0 means that none of the proteins is correctly identified. In this study, if the detected proteins and the query protein are in the same SCOP superfamily, the detected proteins are considered as true positives, otherwise they are false positives. The jackknife validation is employed to evaluate the performance of methods, because it is deemed the most objective cross-validation approach.
Table 1 shows the performance of various methods on SCOP v1.59, from which we can see that the performance of the three predictors (PSI-BLAST, HHblits and Hmmer) can be improved by using the pseudo protein approach. ProtDec-LTR2.0 obviously outperforms ProtDec-LTR in term of ROC1, and is highly comparable with ProtDec-LTR in term of ROC50.
Table 1. The performance comparison between ProtDec-LTR2.0 and other related methods on SCOP v1.59 via jackknife validation.
| Methods | ROC1 | ROC50 |
| ProtDec-LTR2.0 | 0.8911 | 0.8955 |
| ProtDec-LTR | 0.8510 | 0.8969 |
| Pse-PSI-BLAST | 0.7900 | 0.8127 |
| Pse-HHblits | 0.8246 | 0.8737 |
| Pse-Hmmer | 0.8016 | 0.8212 |
| PSI-BLAST | 0.7718 | 0.7794 |
| HHblits | 0.8187 | 0.8669 |
| Hmmer | 0.7796 | 0.7830 |
| Coma | 0.6989 | 0.7785 |
| ProtEmbed | 0.8136 | 0.8897 |
| dRHP-PseRA | 0.8314 | 0.8924 |
In order to further evaluate its performance, ProtDec-LTR2.0 is evaluated on the updated benchmark dataset SCOPe v2.06, and the results are shown in Fig. 5, from which we can see that ProtDec-LTR2.0 obviously outperforms the basic predictors in terms of ROC1and ROC 50.
7. References (back to content)
| 1. | Liu B, Chen J, Wang X. Application of Learning to Rank to protein remote homology detection, Bioinformatics 2015;31:3492-3498. |
| 2. | Liu B, Zhang D, Xu R et al. Combining evolutionary information extracted from frequency profiles with sequence-based kernels for protein remote homology detection, Bioinformatics 2014;30:472-479. |
| 3. | Liu B, Wang X, Lin L et al. A discriminative method for protein remote homology detection and fold recognition combining Top-n-grams and latent semantic analysis, BMC bioinformatics 2008;9:510. |
| 4. | Chen J, Long R, Wang X-l et al. dRHP-PseRA: detecting remote homology proteins using profile-based pseudo protein sequence and rank aggregation, Scientific Reports 2016;6:32333. |
| 5. | Holm L, Sander C. Removing near-neighbour redundancy from large protein sequence collections, Bioinformatics 1998;14:423-429. |
| 6. | Altschul SF, Madden TL, Schäffer AA et al. Gapped BLAST and PSI-BLAST: a new generation of protein database search programs, Nucleic acids research 1997;25:3389-3402. |
| 7. | Remmert M, Biegert A, Hauser A et al. HHblits: lightning-fast iterative protein sequence searching by HMM-HMM alignment, Nature methods 2012;9:173-175. |
| 8. | Finn RD, Clements J, Eddy SR. HMMER web server: interactive sequence similarity searching, Nucleic acids research 2011;39:W29-37. |
| 9. | Liu T-Y. Learning to rank for information retrieval, Foundations and Trends in Information Retrieval 2009;3:225-331. |
| 10. | Liu T-Y, Xu J, Qin T et al. Letor: Benchmark dataset for research on learning to rank for information retrieval, Foundations and Trends in Information Retrieval 2009;3(3):225-331. |
| 11. | Sculley D. Large scale learning to rank, NIPS Workshop on Advances in Ranking 2009; 58-63. |
| 12. | Murzin AG, Brenner SE, Hubbard T et al. SCOP: a structural classification of proteins database for the investigation of sequences and structures, Journal of molecular biology 1995;247:536-540 |
| 13. | Fox, N.K., Brenner, S.E. and Chandonia, J.-M.. SCOPe: Structural Classification of Proteins—extended, integrating SCOP and ASTRAL data and classification of new structures, Nucleic acids research 2014;42:D304-D309 |
| 14. | Gribskov, M. and Robinson, N.L. Use of receiver operating characteristic (ROC) analysis to evaluate sequence matching, Computers & chemistry 1996;20:25-33 |